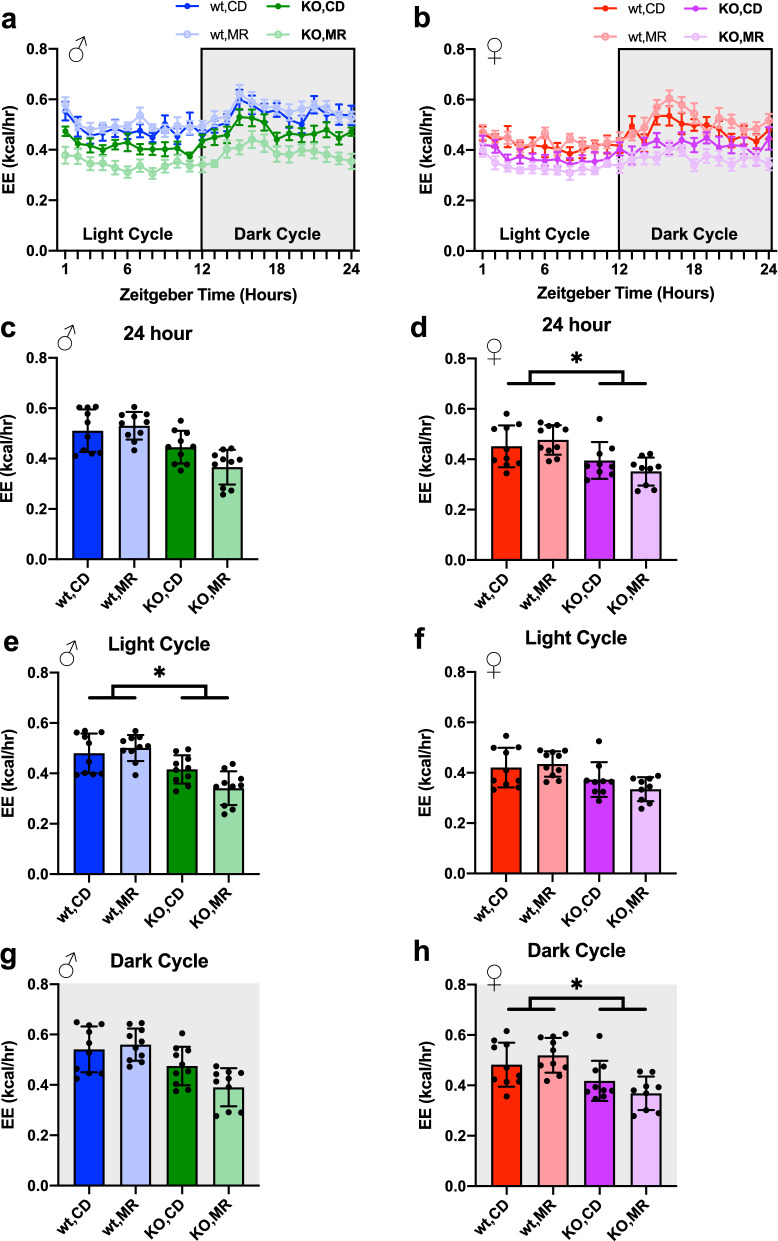
Figure 6.
Energy Expenditure was not impacted by MR. Energy Expenditure (EE) for 24 h period based on VO2 not normalized to mass for mice from Cohort 2 (a), (b). Data averaged over the 24 h test period (c), (d), and for the light (e), (f) and dark (g), (h) cycle separately. Analyzed with ANCOVA using lean mass as a control variable for AUC graphs of EE for full 24 h as well as light and dark cycles. Line graph represents mean ± s.e.m., bar graphs represent mean ± s.d. Groups were 9–10 mice. (*p < 0.05).

