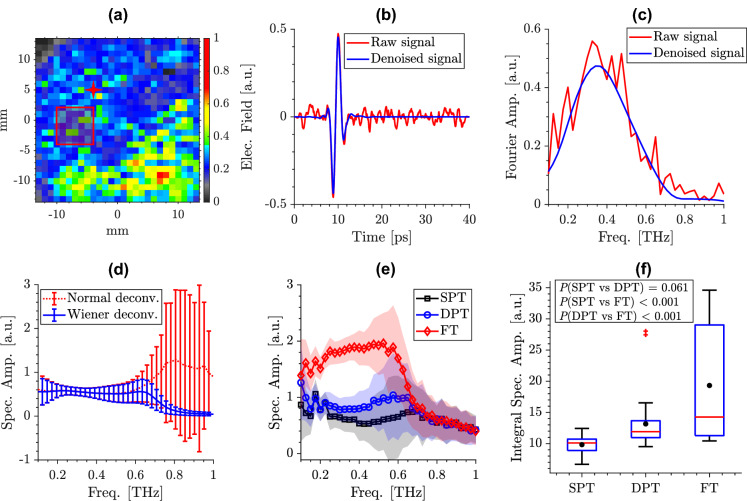
Figure 5.
(a) A representative THz image of a burn created with 70 C scald device over a 27 by 27 mm field-of-view. The color axis shows the normalized area under the reflection spectral amplitude curves between 0.1 and 0.5 THz. (b) the wavelet denoising outcome in an example THz-TDS pulse selected from a pixel marked by the red star in (a), and (c) the Fourier amplitude of the signals shown in (b), (d) comparison between normal and Wiener deconvolution in a 4 4-pixel ROI shown using the red box in (a), where Wiener deconvolution effectively avoids the high-frequency spikes originated from an ill-posed deconvolution implementation, (e) the average spectral amplitude of reflectivity obtained after the Wiener deconvolution, along the standard deviation over the pixels of three ROIs, each selected randomly from a different burn grade example, i.e., SPT (black line, square markers), DPT (blue line, circle markers), FT (red line, diamond markers), (f) box plots comparing the area under the spectral amplitude curves in all burns (composed of thirty 4 4-pixel ROIs randomly selected from the burns in each group) over 0.1–0.5 THz, using a one-way ANOVA, the difference between SPT and FT groups ( < .001), and DPT and FT groups ( < .001) is statistically significant, while the (SPT vs DPT) = 0.061.

