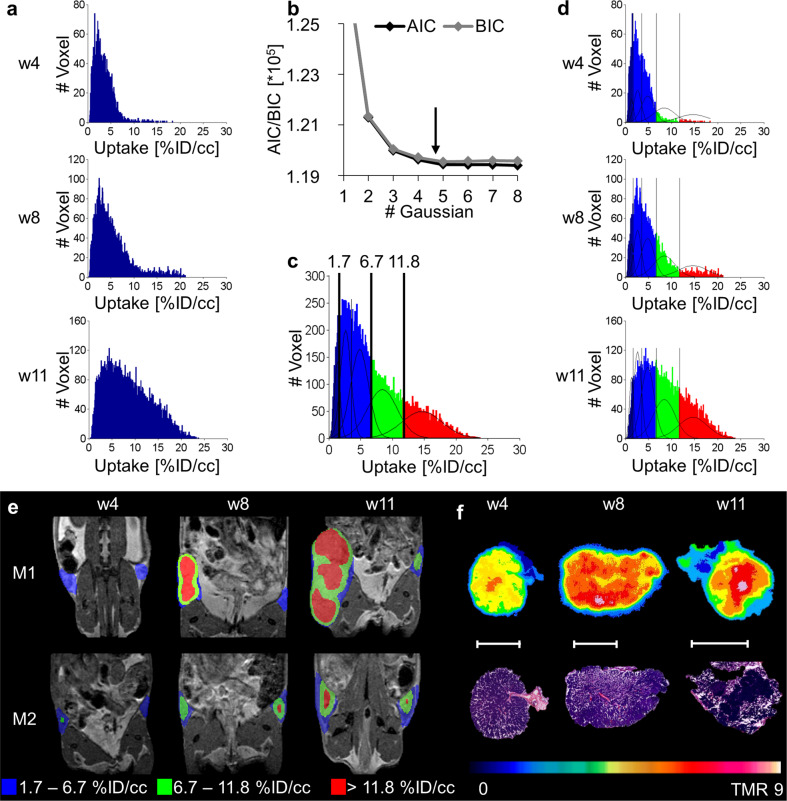
Fig. 1. GMM analysis of [18F]FDG over time correlates with different tumor stages.
a Summed histograms of all analyzed lesions of the single time points (w4: n = 16; w8: n = 15; w11: n = 13). Due to spillover effects from surrounding tissues (e.g., bladder), some lesions were excluded from the analysis. The three histograms were summed, and GMM analysis was performed on the summed data of all time points. b AIC and BIC for different numbers of Gaussian distributions, reaching its minimum at a sum of 5 Gaussian distributions. c Calculated thresholds from the 5 Gaussian mixture model were transferred to the summed histogram to separate the populations. d Applying the thresholds to the single time points demonstrates the appearance of the low uptake population in blue (< 6.7%ID/cc), the moderate uptake population in green (6.7–11.8%ID/cc), and the highest uptake population in red (> 11.8%ID/cc) for different time points. e Parametric maps of the lesions of two representative mice confirm the appearance of the increased uptake populations (green and red) during tumorigenesis. f Autoradiography of different tumor slides and corresponding H&E verified the highest [18F]FDG uptake in solid tumor regions, whereas hyperplastic regions of the lesions showed the lowest uptake. The white scale bar indicates 5 mm.

