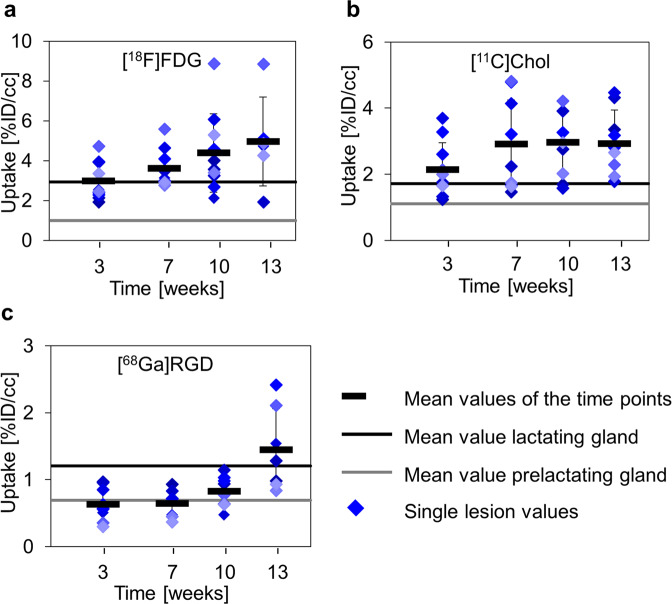
Fig. 3. Mean value analysis of tracer uptake.
Mean values (black bars) ± standard deviation, as well as single values, for every lesion (filled diamonds) of the investigated tracer were plotted over time and compared to prelactating (gray line) and lactating (black line) mammary glands. a [18F]FDG uptake showed a steady increase in uptake from w3, starting at the level of the lactating glands to w13. b [11C]Chol showed a slight increase from w3 to w7 and a stable mean value from w7 until w13. c [68Ga]RGD uptake was observed in the range of the prelactating glands from w3 to w10 and increased from w10 to w13. A statistically significant difference between MIN-O lesions and pre- or lactating glands was not observed for any of the tracers.

