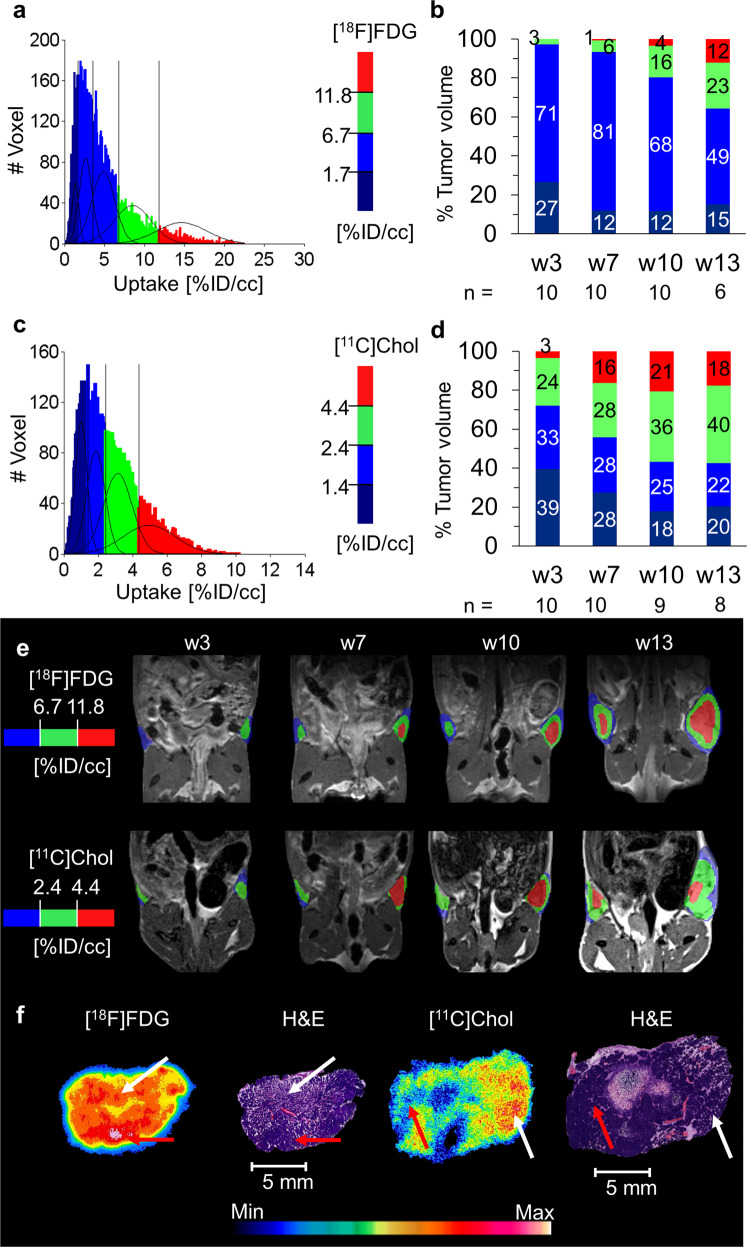
Fig. 4. [18F]FDG and [11C]Chol clustering mismatch identifies tumor stages.
a The summed and fitted histogram of [18F]FDG, as well as b the volumetric percentage of the uptake populations within the lesions for every time point, demonstrated a high amount of the low [18F]FDG uptake populations within the lesions in this study, including at later time points. The high uptake population (> 11.8%ID/cc) showed a slight increase over time up to 12% of the late-stage lesions in w13. c The summed histogram of all time points of [11C]Chol was analyzed as described for [18F]FDG, and the sum of four Gaussian distributions were identified as the best model. d The volumetric percentage of the uptake populations within the lesions for every time point demonstrated a lower amount of low [11C]Chol uptake populations compared to [18F]FDG. After a slight increase of the higher uptake populations (green, 2.4–4.4%ID/cc and red, > 4.4%ID/cc) from w3 to w7 and w10, both remained relatively stable until w13. e The parametric maps showed the appearance of the highest uptake populations at w7 in single tumors for both tracers, staying stable over time for [11C]Chol and increasing for [18F]FDG. f The autoradiography results of representative tumor slides demonstrated the highest [18F]FDG uptake in IC regions (red arrows), whereas the highest [11C]Chol uptake was observed in proliferating regions including DCIS-like high-grade MIN (white arrows) rather than invasive tumor regions.

