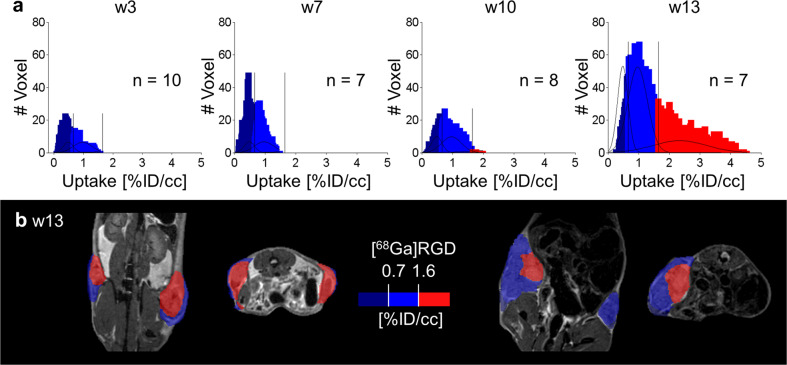
Fig. 5. GMM analysis of [68Ga]RGD characterized IC regions.
a The summed histogram of [68Ga]RGD uptake of all tumors and all time points was fitted and analyzed as described above for [18F]FDG, resulting in a sum of 3 Gaussian distributions as the best model. The thresholds 0.7 and 1.6%ID/cc were applied to the histograms of the single time points. b Representative PET/MR images revealed the highest uptake population (red, > 1.6%ID/cc) in only large tumors.

