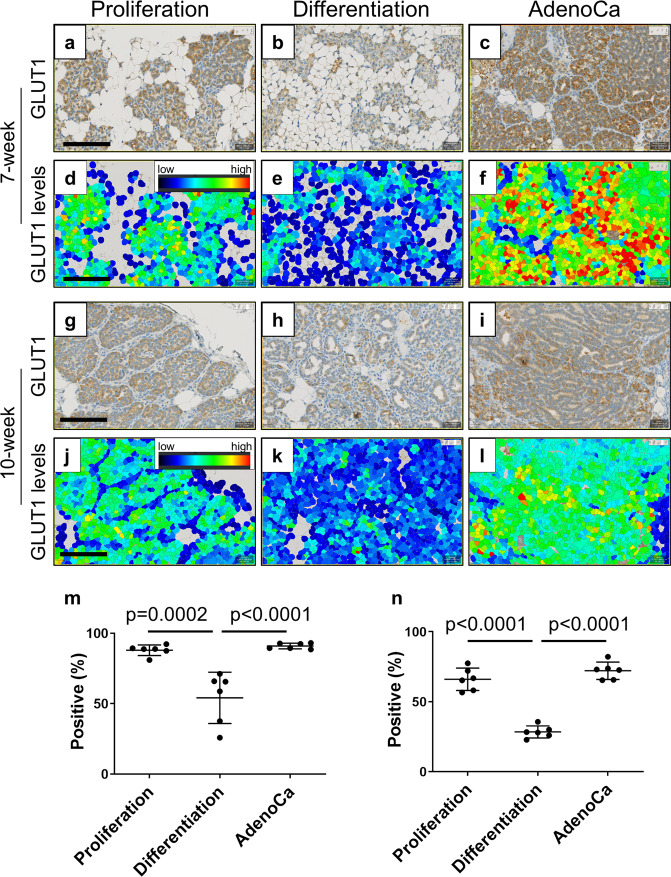
Fig. 6. Quantitative GLUT1 expression.
The higher levels of GLUT1 positive cells are observed at proliferation zones and tumor areas. GLUT1 stained MIN-O tissues at 7-week a–f and 10-week g–l were analyzed for positive cell density m, n and the levels of GLUT1 d–f, j–l. Images were analyzed at proliferation zones a, d, g, j, differentiation zones b, e, h, k and tumor areas (indicated as AdenoCa; c, f, i, l. The color indicates the levels of GLUT1 d–f, j–l as brighter color as higher GLUT1 levels and dark color as lower GLUT1 levels. m, n Graphs show the measurement of GLUT1 positive cell densities (positive percentage) at proliferation zones, differentiation zones and tumor areas in m 7-week and n10-week MIN-O tissues. Bars represent mean value ± standard deviation. Scale bar indicates 100 µm. All images were adjusted to same magnification.

