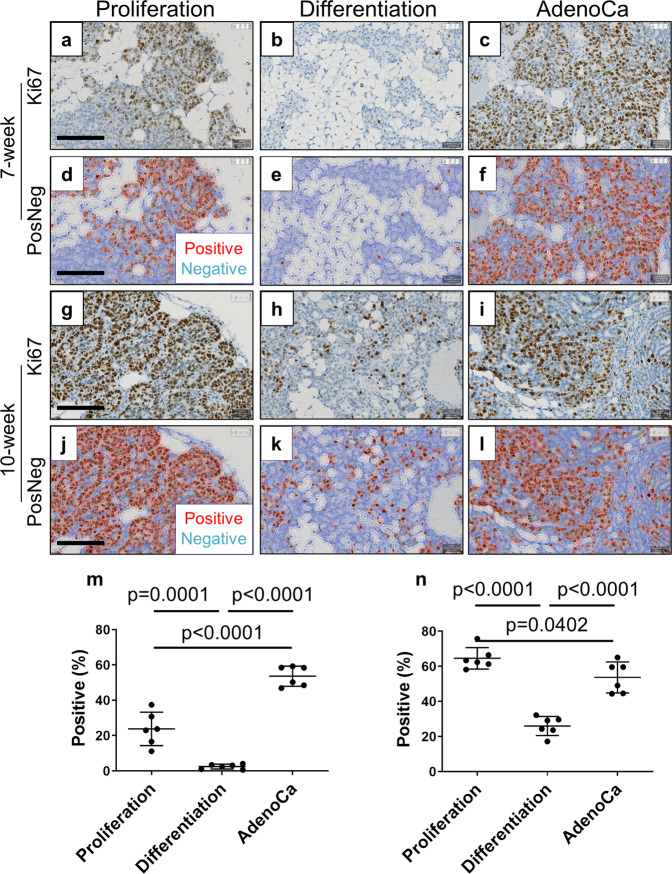
Fig. 7. Quantitative Ki67 expression.
Proliferation zones and tumor areas are highly proliferative compared with differentiation zones. Ki67 stained MIN-O tissues at 7-week a–f and 10-week g–l were analyzed for cell proliferation m, n. Images were analyzed at proliferation zone a, d, g, j, differentiation zones b, e, h, k and tumor areas (indicated as AdenoCa; c, f, i, l. The analysis for Ki67 positive cells were performed on QuPath by identifying nuclear Ki67 signals. Images shown as “PosNeg” indicate red cells as Ki67 positive and blue cells as Ki67 negative. The densities of Ki67 positive cells (positive percentage) were analyzed at proliferation zones, differentiation zones and tumor areas in m 7-week and n 10-week MIN-O tissues. Bars represent mean value ± standard deviation. m Scale bar indicates 100 µm. All images were adjusted to same magnification.

