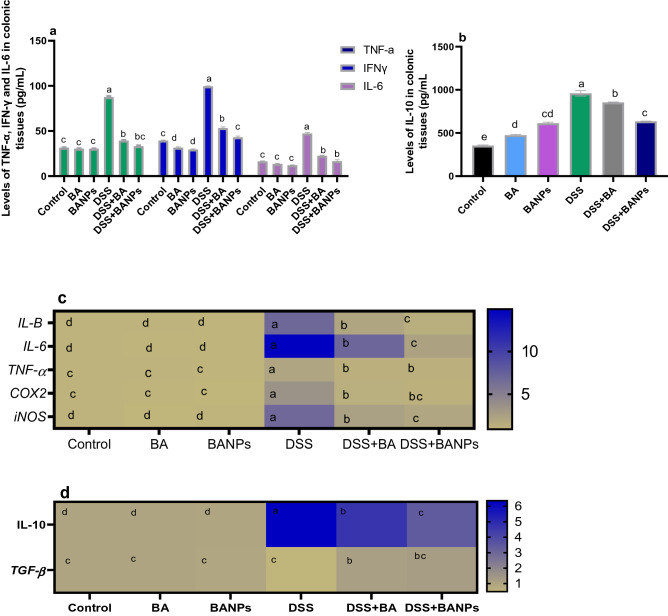
Figure 5.
Effects of orally administered B. amyloliquefaciens (BA) or BA-nanoparticles (BANPs) in non-colitic and colitic rats on measurement of cytokines protein levels by ELISA kits (a,b) and heat map illustrating mRNA of various inflammatory markers including cytokines by real time PCR (c,d) 7 days post DSS induction. Interleukin (IL)-1β, IL-6, IL-10, tumor necrosis factor α (TNFα), transforming growth factor-beta (TGF-β), cyclooxygenase-2 (COX-2) and Inducible nitric oxide synthase (iNOS). Non-colitic groups including Control, BA and BANPs groups where rats were orally gavaged PBS, B. amyloliquefaciens and B. amyloliquefaciens loaded nanoparticles (BA at level of 1.0 × 10¹⁰ CFU/kg in 1 mL of PBS/rat/day), respectively, for 7 days. Colitic groups: DSS, BA and BANPs groups where rats were orally gavaged dextrane sodium sulphate (DSS), B. amyloliquefaciens + DSS and B. amyloliquefaciens loaded nanoparticles (BA at level of 1.0 × 10¹⁰ CFU/kg in 1 mL of PBS/rat/day) + DSS, respectively, for 7 days. All groups orally gavaged by 5% DSS. Values are expressed as mean ± SE, a,b,cMeans of the bars with different letters were significantly different among groups (P < 0.05). The scale bar on the right side described the unit for each color as blue and light green squares corresponded to significant upregulation and downregulation, respectively of genes relative to the control groups (P < 0.05).

