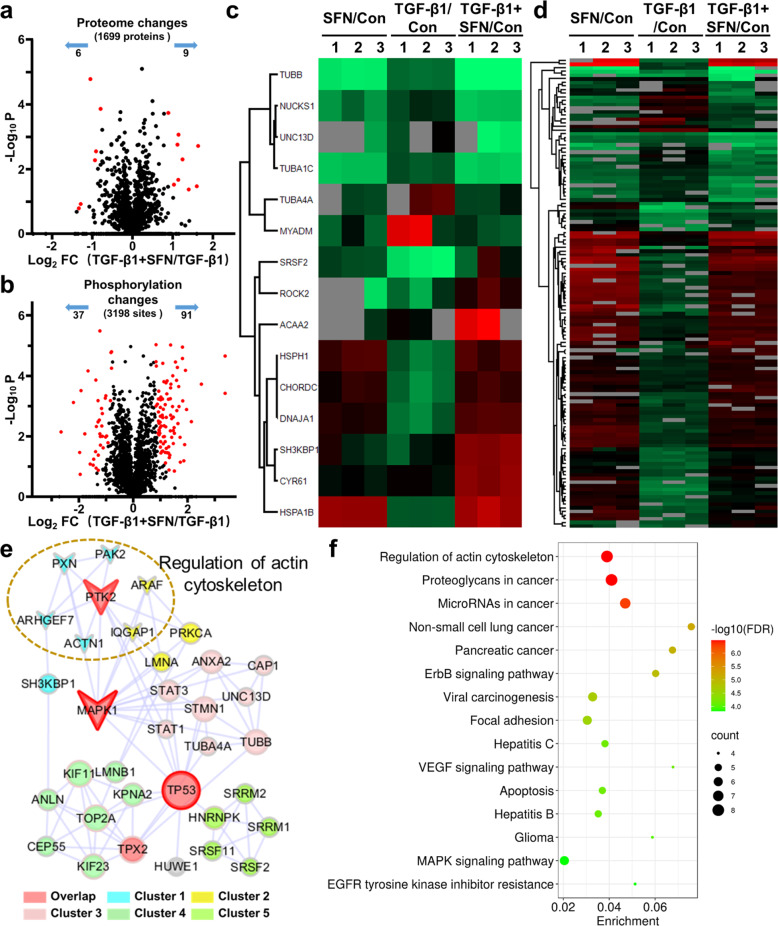
Fig. 5. Proteosomic and phosphoproteomic analysis in MDA-MB-231 cells treated with TGF-β1 in the absence or presence of SFN.
a A volcano plot shows that 15 proteins (red dots) changed significantly (FDR <0.05, S0 of 1) upon SFN treatment. b A volcano plot shows that 128 localized phosphorylation sites (red dots) changed significantly (FDR <0.05, S0 of 1) upon SFN treatment. c Cluster analysis of differentially expressed proteins. d Cluster analysis of differentially expressed phosphorylation sites. e The core network of protein–protein interaction map of the altered proteins and phosphoproteins that are illustrated with color by clusters and size by degree. MAPK1, TP53, and PTK2 are in the top three degrees and served with a red border. The nodes involved in the regulation of the actin cytoskeleton are displayed by arrows. f KEGG pathways enrichment of core altered proteins and phosphoproteins.

