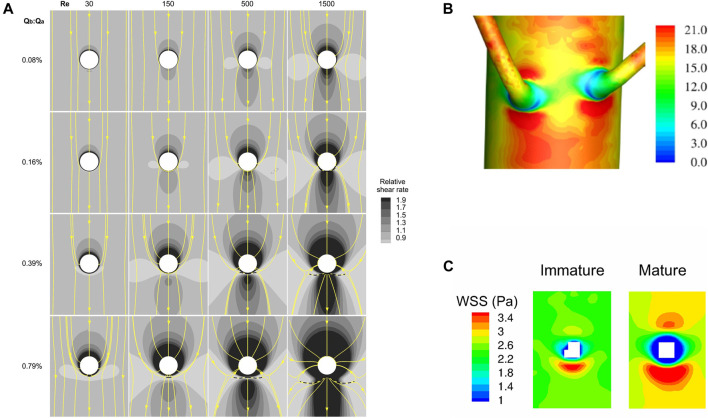
FIGURE 8.
(A) Maps of the effect of Reynolds number and the ratio of branch to aortic flow rate on computed WSS around the ostium (white) of an idealised branch emerging from a flat plate, viewed en face with mean flow from top to bottom (Kazakidi et al., 2009). Surface streamlines are also shown. (B) Patterns of WSS (Pa) around a pair of aorto-intercostal junctions, computed for steady flow in a realistic representation of the rabbit anatomy and viewed from outside the vessel, with mean flow from top to bottom (Vincent et al., 2011). (C) Maps of WSS around intercostal ostia (white) computed for steady flow in realistic representations of an immature and a mature rabbit anatomy, viewed en face with mean flow from top to bottom (Peiffer et al., 2012).

