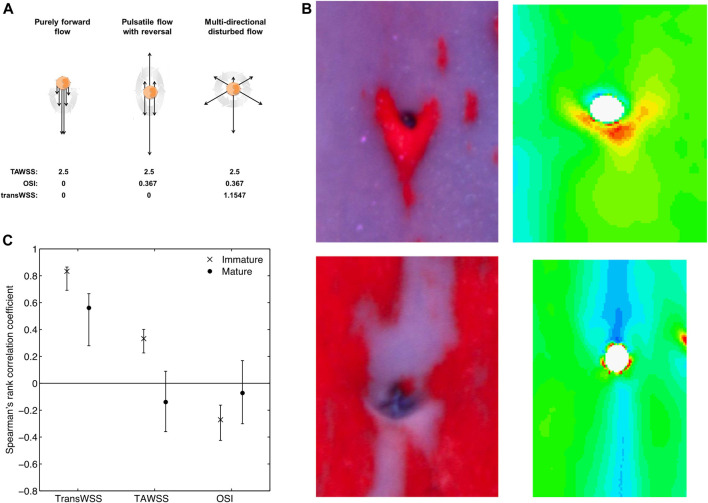
FIGURE 9.
(A) Sketch showing that the same time average WSS (TAWSS) and OSI can occur for markedly different types of flow, therefore justifying the need for the transWSS metric capturing the directionality of flow. Dark arrows represent instantaneous flow vectors and the large grey arrow represents time throughout one cycle (Peiffer et al., 2013a; Mohamied et al., 2015). (B) Examples of diet-induced lesions (left) and computed transWSS (right) around intercostal branch ostia in the aortas of immature (top) and mature (bottom) rabbits, viewed en face with mean flow from top to bottom. (Peiffer et al., 2013a). (C) Coefficients (mean and confidence interval) for the correlation between patterns of lesions and patterns of each of the three WSS metrics, in immature and mature rabbits. Correlations are significant if the confidence interval does not include zero (Mohamied et al., 2015).

