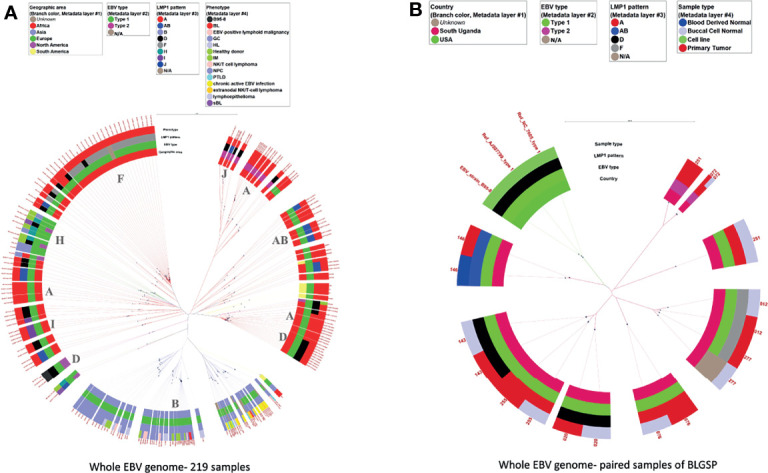
Figure 3.

Phylogenetic tree of whole EBV genomes from samples with various conditions and from different geographic areas. (A) 219 whole EBV genomes, (B) 9 tumor-normal pairs of the BLGSP dataset. The sample conditions were color-coded. The rings from the inner side to the outer side are annotations for the Geographic area, EBV type, LMP-1 pattern, and phenotype of each sample. The missing data were tan color. The black dots indicate the positions of each sample away from the root (center). The scale bar value for distancing: (A) 0.006 (B) 0.009. The dominated LMP-1 pattern of the corresponding clade was annotated in the inner circle. The color of the extension line of each sample is consistent with the color of the Geographic area. Three genomic sequences of EBV type 1 obtained from GenBank, including the original NC_07605 derived from B95-8 cell line and genomic sequencing datasets of the same cell line by 2 other different labs, were used as references for analytic classification in Figure (B).
