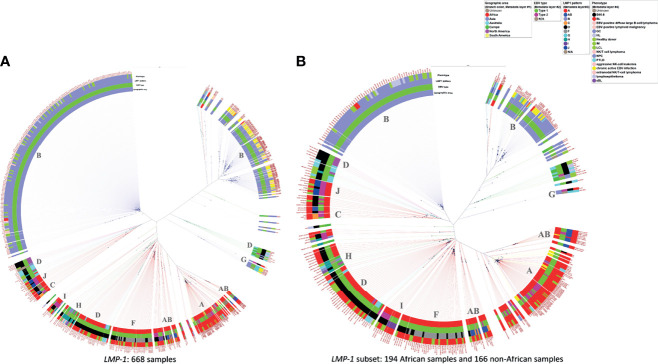
Figure 4.
Phylogenetic tree of LMP-1 sequences from samples with various conditions and from different geographic areas. (A) 668 available sequences of LMP-1, (B) 360 LMP-1 sequences from 194 African samples and 166 non-African samples for lowering the graphic density for better visualization. The rings from the inner side to the outer side are annotations for the Geographic area, EBV type, LMP-1 pattern, and phenotype of each sample. The black dots indicate the positions of each sample away from the center. The scale bar value for distancing: (A) 0.022 (B) 0.035. The dominant LMP-1 pattern of the corresponding clade was annotated in the inner circle. The color of the extension line of each sample is consistent with the color of the Geographic area.

