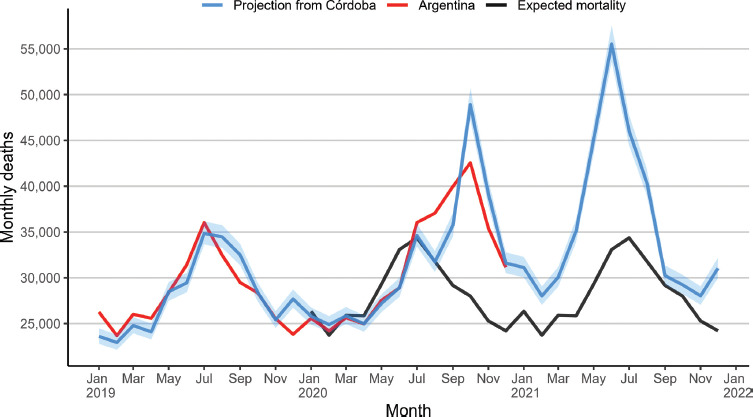
FIGURE 2. Monthly deaths in Argentina – observed, expected and projected from Córdoba.

Note: Pearson r = 0.91 between projected deaths from Córdoba and observed deaths for all Argentina in 2019-2020.
Source: Prepared by authors from the results.

Note: Pearson r = 0.91 between projected deaths from Córdoba and observed deaths for all Argentina in 2019-2020.
Source: Prepared by authors from the results.