Figure 1.

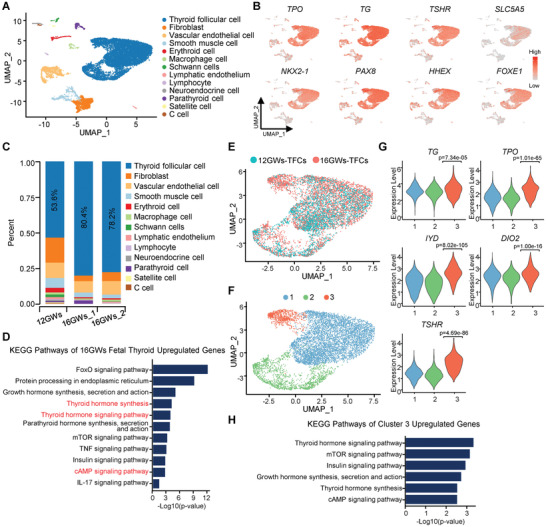
Single‐cell transcriptome survey of developing human fetal thyroid gland. A) UMAP of fetal thyroid tissue from two different gestational weeks (12GWs and 16GWs), with cells colored by cell type. B) UMAP showing the expression levels of thyroid follicular cell markers and four key transcriptional factors. C) The proportion of diverse cell types in human thyroid gland at two different developmental time points (12GWs and 16GWs). D) KEGG analysis of upregulated genes that are differentially expressed in thyroid follicular cells of 16GWs, compared to 12GWs. E) UMAP of thyroid follicular cells (TFCs) from 12GWs (blue dots) and 16GWs (red dots) of fetuses. F) UMAP plot showing three cell clusters of TFCs partitioned by single‐cell transcriptome. G) Violin plot showing marker genes expression of the three cell clusters in TFCs. p‐value was performed by Wilcoxon Rank Sum test between cluster 3 against other clusters. H) KEGG analysis of genes differentially expressed in cluster3 of TFCs in (F).
