Figure 3.

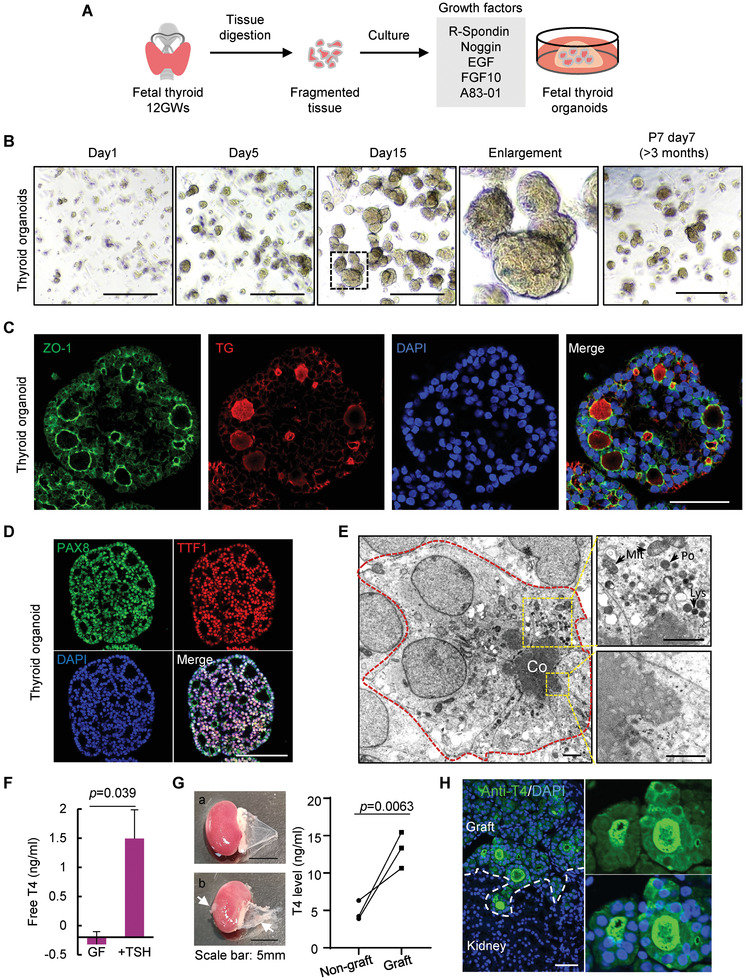
Generation of reproducible human fetal thyroid organoids. A) Schematic depicting the digestion and seeding of fetal thyrocytes, and the culture medium of hFTOs. B) Representative images of a series time points of Passage 0 (P0) and Passage 7 (P7) thyroid organoids. Scale bars = 500 µm. The dotted box indicated zoomed region. C) Immunofluorescence double‐labeled hFTOs (P1) of ZO‐1 and TG, and nuclei with DAPI. Scale bar = 50 µm. D) Immunofluorescence double‐labeled hFTOs (P1) of PAX8 and TTF1 (also known as NKX2‐1), and nuclei with DAPI. Scale bar = 100 µm. E) Transmission EM of hFTOs showing typical monolayer epithelial follicle structures formed by monolayer cells (outline with red dashed line). Co, colloid; scale bar = 5 µm. The upper box showing mitochondria (Mit), lysosome (Lys), and peroxisomes (Po) in cytoplasm, scale bar = 2µm; the bottom box showing the microvilli, scale bar = 1µm. F) Free T4 secretion measured after 4 days culturing with/without TSH simulation in growth factors (GF) medium. Data are represented as mean ± SD in two independent experiments. G) On the left panel: Photos of NSG mouse kidney with stripped renal capsule. a) Non‐graft kidney with smooth renal capsule; b) The grafted kidney with xenograft under the capsule. White arrow indicates xenograft. On the right panel: T4 level of supernatant of renal capsule with/without xenograft detected by ELISA. The wires represent three pairs of kidneys in three independent mice. H) The immunofluorescence of anti‐T4 and DAPI in the grafted tissue. A zoomed‐in photo is showing on the right. White dashed line divided the graft and kidney tissue. Scale bar: 50 µm.
