
Figure 7.
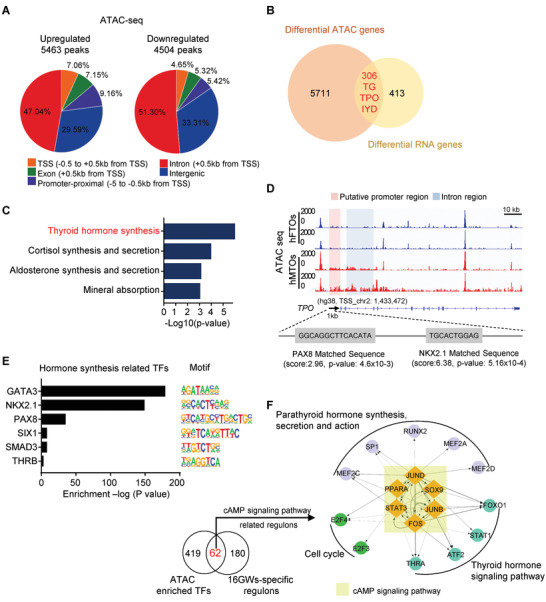
Enhanced chromatin accessibility permitted transcriptome for fetal thyroid fate determination. A) Distribution of differentially accessible ATAC peaks on genome in hFTOs and hMTOs. B) Venn diagram showing the overlap between differential peak genes from ATAC‐seq and differential expressed genes from RNA‐seq. The comparison was between hFTOs and hMTOs. C) KEGG analysis of upregulated overlap genes (220/306 genes), showing enrichment of thyroid hormone synthesis pathway. D) ATAC‐seq signals at TPO genome site of two biological replicates in hFTOs and hMTOs showing by integrative genomics viewer. PAX8 and NKX2.1 motif scanning at TPO genome site using MEM Suite website. Pink framework indicates putative promoter regions within 1 kb from TSS (transcription start site), and blue framework indicates intron regions. Scale bar = 10 kilobase (kb). E) Motif analysis of differential ATAC peaks in hMTOs upregulated genes for putative transcription factor (TF) binding sites of thyroid hormone synthesis related using HOMER Database. F) Left: Number of overlapped TFs between ATAC‐enriched TFs and 16GWs‐specific regulons. Right: Regulatory networks of selected TFs (nodes) from motif analysis of differential ATAC peaks. Arrow on edge from node X to node Y indicates that TF‐X regulates TF‐Y. To aid interpretation of the network, nodes are grouped and colored according to their regulatory signaling pathways.