
FIG. 2.
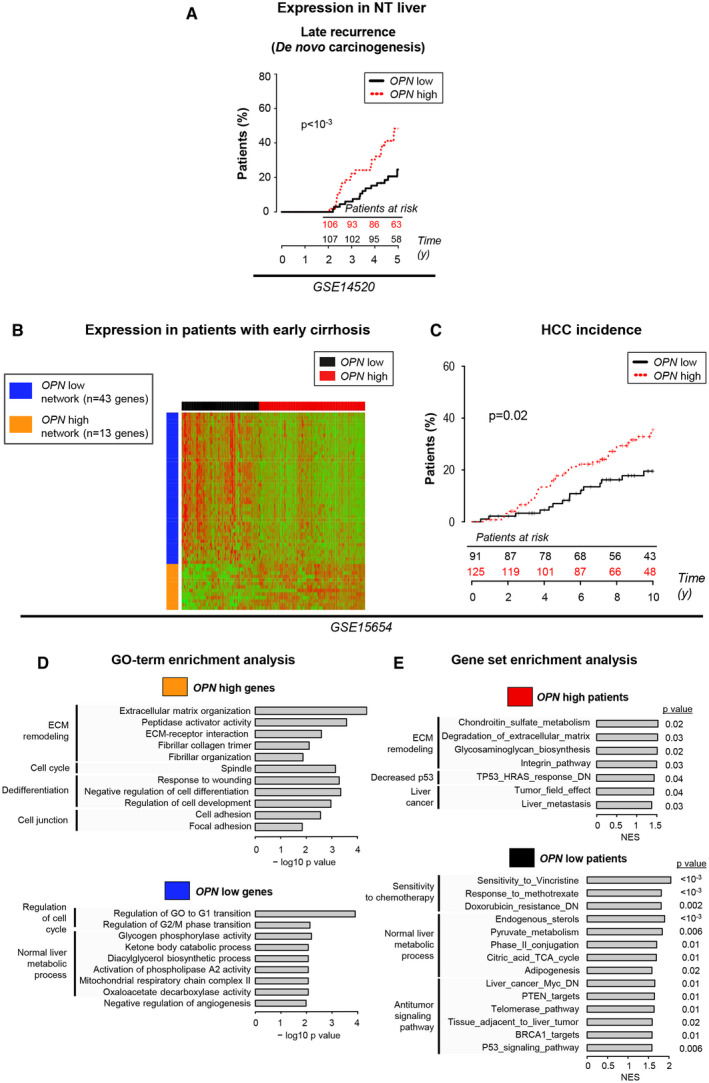
OPN mRNA expression in early and advanced cirrhosis correlates with HCC incidence and signatures of carcinogenesis. (A) Kaplan‐Meier curves of HCC late recurrence and clinical data analysis based on the OPN mRNA expression in NT tissue, using the median as a threshold. (B) In 216 patients with early‐stage liver cirrhosis,( 26 ) hierarchical clustering was performed based on the mRNA expression of genes positively (orange) or negatively (blue) correlated with OPN (abs[Pearson] > 0.3) and identified two groups of patients (OPN‐high [red] and OPN‐low [black]). (C) Kaplan‐Meier curves of HCC incidence of OPN‐high and OPN‐low patients. (D) GO‐term enrichment analysis of the OPN‐high and OPN‐low genes. (E) GSEA of the OPN‐high and OPN‐low patients. Abbreviation: NES, normalized enrichment score.