
FIG. 3.
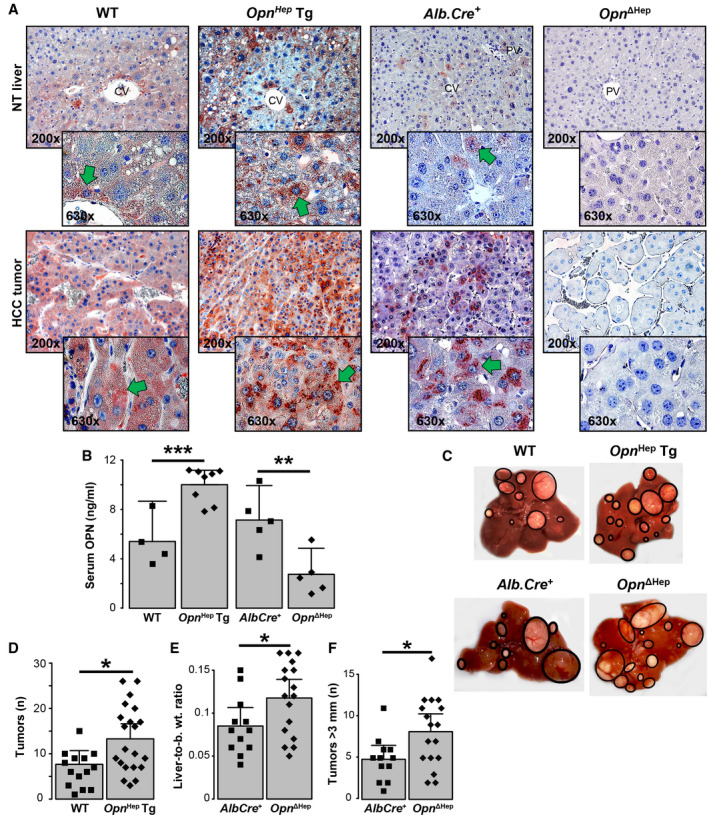
Overexpression and ablation of Opn in hepatocytes drives carcinogenesis in DEN‐injected mice. WT (n = 15), Opn Hep Tg (n = 21), Alb.Cre + (n = 12), and Opn ΔHep (n = 17) mice were injected DEN and sacrificed 12 months later. (A) IHC for OPN (green arrows). (B) Serum OPN in WT (n = 4), Opn Hep Tg (n = 8), Alb.Cre + (n = 5), and Opn ΔHep (n = 5) mice (mean ± SEM). (C) Representative gross appearance of the livers. (D) Number of macroscopic tumors per group (mean ± SEM), number of macroscopic tumors >3 mm per mouse liver (mean ± SEM) (E), and liver‐to–body weight ratio (mean ± SEM) (F). *P < 0.05, **P < 0.01, and ***P < 0.001. Abbreviation: b. wt., body weight.