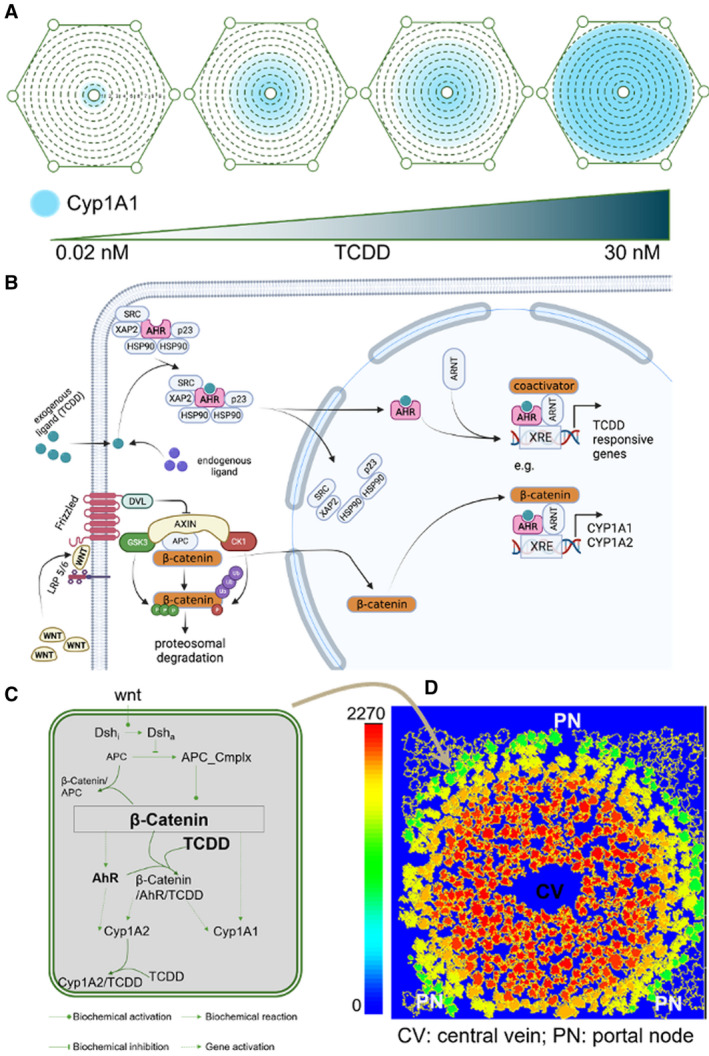
FIG. 1.

A multiscale computational model simulates hepatic zonal induction of Cyp1A1 by TCDD. (A) Zonal induction of Cyp1A1 in the mouse liver lobule by TCDD. The central‐to‐portal axis is segmented into nine zones following Halpern et al.(11) The area of the liver lobule expressing Cyp1a1 increases with increasing TCDD dose. (B) Schematic representation of the AHR and β‐catenin pathways and their intersection (made in BioRender [biorender.com]). (C) Intracellular model of the Wnt signaling pathway and downstream gene regulatory network for induction of Cyp1A1 by TCDD. (D) Multiscale virtual liver lobule model. The locations of the cells are calibrated from a single‐cell resolution image of the lobule in Halpern et al(11); the signaling pathway from (C) is implemented in each cell of the lobule model. The colors of the cells represent the expression level of Cyp1A1. Abbreviations: CV, central vein; and PV, portal vein.
