Figure 3.

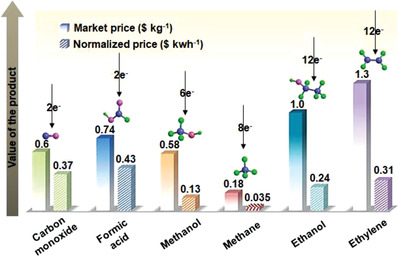
Comparisons of the market prices ($ kg–1) and added values per kWh electrical energy input ($ kWh–1) values of the representative hydrocarbons. Reproduced with permission.[ 15 ] Copyright 2019, Wiley‐VCH.

Comparisons of the market prices ($ kg–1) and added values per kWh electrical energy input ($ kWh–1) values of the representative hydrocarbons. Reproduced with permission.[ 15 ] Copyright 2019, Wiley‐VCH.