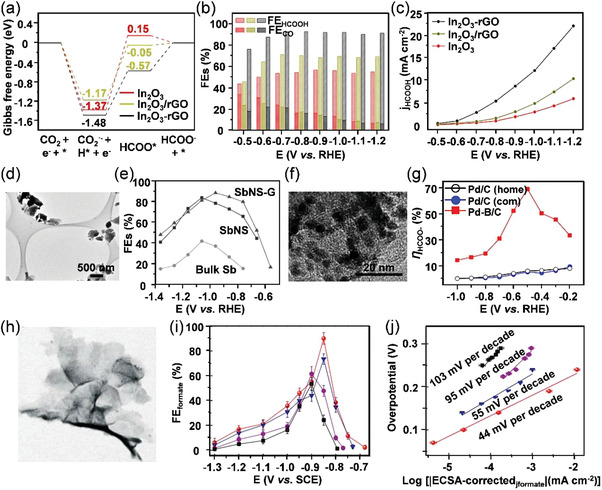
Figure 7.

a) Gibbs free energy diagrams for CO2 reduction to formate on In2O3‐rGO hybrid, In2O3/rGO, and In2O3 catalysts. b) FECO, FEformate, and c) J formate for In2O3–rGO hybrid, In2O3/rGO, and In2O3 catalysts. The color codes in (c) apply to (b). Reproduced with permission.[ 30 ] Copyright 2019, American Chemical Society. d) TEM image of Sb nanosheets. e) FEformate values of bulk Sb, Sb nanosheets, and Sb nanosheets‐graphene composite catalysts at different potentials. Reproduced with permission.[ 35 ] Copyright 2017, Wiley‐VCH. f) TEM image and the size distribution histogram of Pd‐B/C catalyst. g) Potential dependent FEformate of Pd‐B/C, Pd/C (home), and Pd/C (com) catalysts. Reproduced with permission.[ 40 ] Copyright 2019, John Wiley & Sons, Inc. h) TEM image of partially oxidized Co 4‐atom‐thick layers. i) FEformate at each applied potential and j) ECSA‐corrected Tafel plots for formate production of partially oxidized Co 4‐atom‐thick layers (red), Co 4‐atom‐thick layers (blue), partially oxidized bulk Co (violet), and bulk Co (black). Reproduced with permission.[ 42a ] Copyright 2016, Springer Nature Limited.
