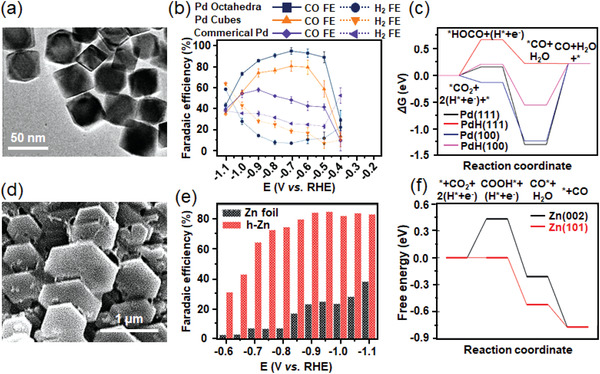
Figure 9.

a) TEM image for Pd octahedra. b) Faradaic efficiencies of reduction products for Pd octahedra in ECR. c) DFT calculated free energy diagrams of ECR on Pd(111), Pd(100), PdH(111), and PdH(100). Reproduced with permission.[ 62 ] Copyright 2019, Wiley‐VCH. d) FE‐SEM image of hexagonal Zn. e) FECO of Zn foil and hexagonal Zn at various constant potentials ranging from −0.6 to −1.1 V versus RHE. f) CO2 reduction pathway on Zn (002) (black solid line) or Zn (101) (red solid line) at −0.71 V versus RHE. Reproduced with permission.[ 75 ] Copyright 2016, Wiley‐VCH.
