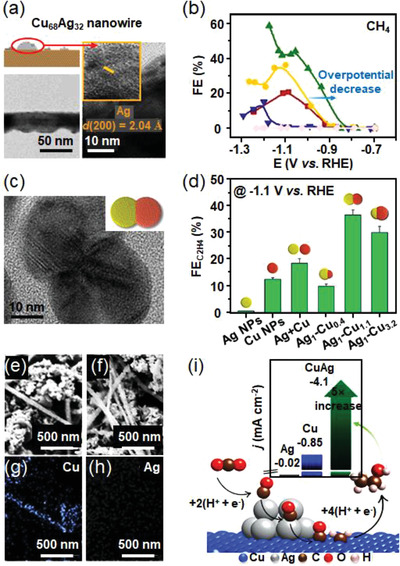
Figure 12.

a) Diagram and TEM image of Cu and Ag for Cu68Ag32. b) Faradaic efficiency as a function of potential of CH4 product for Cu nanowires, and Ag‐modified Cu nanowires samples. Reproduced with permission.[ 107 ] Copyright 2020, American Chemical Society. c) HRTEM images of Ag‐Cu nanodimers. d) FEC2H4 for Ag nanoparticles, Cu nanoparticles, and Ag‐Cu nanodimers with different Ag/Cu ratios at −1.1 V versus RHE. Reproduced with permission.[ 108 ] Copyright 2019, American Chemical Society. SEM images of CuAg composite catalyst e) before and f) after 1 h ECR at −1.1 V versus RHE. The g) Cu and h) Ag EDX maps of CuAg. i) Partial current densities for ethanol production of Ag, Cu, and CuAg catalysts with a possible reaction pathway for CO2‐to‐ethanol conversion on CuAg sites. Reproduced with permission.[ 109 ] Copyright 2020, American Chemical Society.
