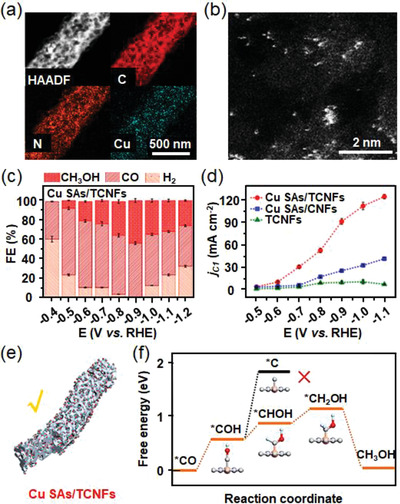
Figure 13.

a) HADDF‐STEM image and the corresponding EDS elemental mappings, as well as, the b) AC HADDF‐STEM image of CuSAs/TCNFs. The white dots in (b) indicate the isolated Cu atoms. c) Faradaic efficiencies of all products at CuSAs/TCNFs. d) Partial current densities of CuSAs/TCNFs, CuSAs/CNFs, and TCNFs. e) Illustration of CO2 molecule diffusion om CuSAs/TCNFs. f) Free energies of *CO conversion to methanol on Cu‐N4 structure. Orange, gray, dark blue, red, and light blue spheres stand for Cu, C, N, O, and H atoms, respectively. Reproduced with permission.[ 105 ] Copyright 2019, American Chemical Society.
