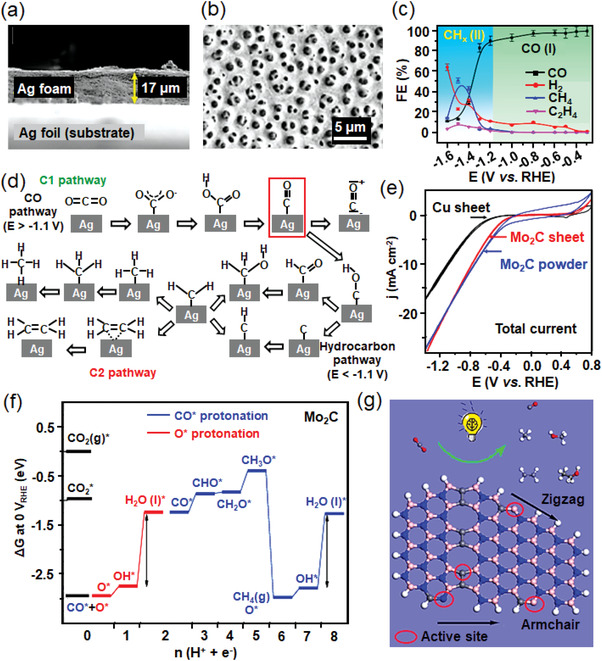
Figure 14.

a) Side‐view and b) top‐down SEM images of the Ag foam. c) The plot of the Faradaic efficiencies as a function of applied potentials for Ag foam. d) Scheme illustration of the proposed reaction pathway of CO and hydrocarbon formations on Ag foam. Reproduced with permission.[ 55 ] Copyright 2018, American Chemical Society. e) CV of Cu sheet, Mo2C sheet, and Mo2C bulk powder for ECR in 0.1 m KHCO3. f) Free energies of CO2 conversion to CH4 over Mo2C(100) surface. Reproduced with permission.[ 124 ] Copyright 2016, American Chemical Society. g) Different active sites of BN for the switchable selectivities of reduction products. Reproduced with permission.[ 127 ] Copyright 2018, American Chemical Society.
