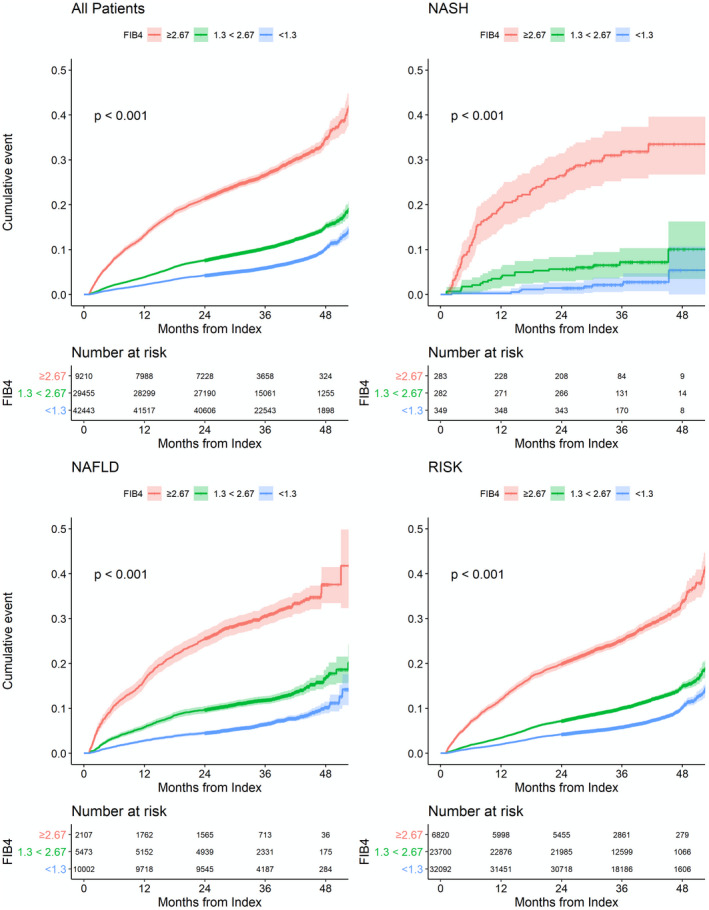
FIG. 2.

Cumulative incidence curves for all‐cause mortality. Cumulative incidence curves for all‐cause mortality according to FIB‐4 and diagnostic group (all patients, RISK, NAFLD, and NASH). Cumulative incidence curves were generated by the Kaplan‐Meier method plotting cumulative incidence of study outcomes by years of follow‐up and compared using a log‐rank test. RISK includes patients with risk profile of NASH using with the following formula: age > 50 years and ALT > 30 U/L and (BMI > 30 kg/m2 or T2DM).
