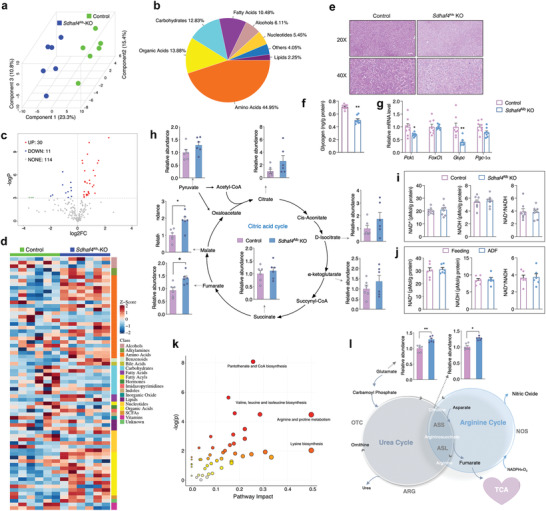
Figure 5.

Suppressed complex II assembly mobilizes amino acid metabolism. a) PLS‐DA scores plot revealing classifications of the samples, b) metabolite classes and compositions, c) enhanced volcano plot showing the differential metabolites, d) Z‐score plot of global metabolic profiles among all the samples, n = 6. e) PAS staining of liver sections and f) biochemical analysis of liver tissues from control and Sdhaf4 Alb KO mice for evaluating glycogen level, n = 8. g) mRNA levels of Pck1, FoxO1, G6pc, Pgc‐1α in livers of control and Sdhaf4 Alb KO mice, n = 8. h) Biochemical analysis of TCA metabolites in liver of control and Sdhaf4 Alb KO mice, n = 6. i) Level of NAD+, NADH, and NAD+/NADH in the liver of control and Sdhaf4 Alb KO mice, n = 8. j) Level of NAD+, NADH, and NAD+/NADH in the liver of mice under regular feeding or ADF intervention for 4 weeks, n = 6. k) Metabolic pathway enrichment analysis comparing the −log(p) to the impact on the various pathways for the network metabolites, n = 6. l) Representative image of urea, arginine biosynthesis, and TCA cycle. Values are mean ± SEM, *p < 0.05, **p < 0.01.
