Figure 7.

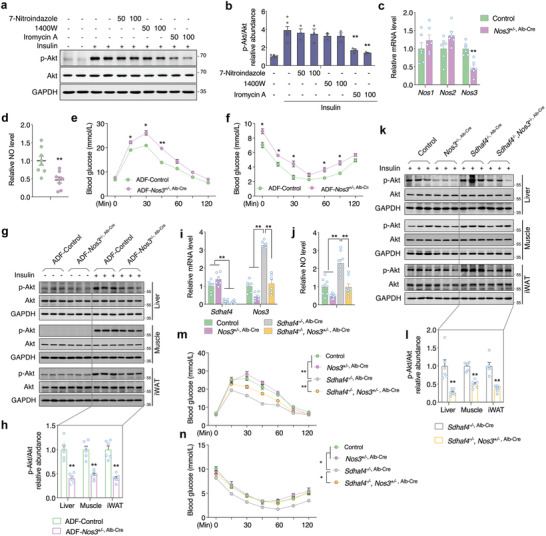
Hepatic NOS3 accounts for the circulating NO in metabolic improved mice. a,b) Immunoblots analysis of p‐Akt in C2C12 cells that co‐cultured with primary hepatocytes from Sdhaf4 Alb KO mice followed with NOS inhibitors for 48 h and insulin challenge for 15 min, n = 6. c) mRNA levels of Nos1, Nos2, and Nos3 in the liver of control and Nos3 hepatic heterozygous knockout mice (Nos3 +/−, Alb‐Cre), n = 6. d) NO level in the serum of control and Nos3 +/−, Alb‐Cre mice, n = 8. e) Glucose tolerance test and f) insulin tolerance test in the control and Nos3 +/−, Alb‐Cre mice under regular feeding or ADF intervention for 4 weeks, n = 6. g) Immunoblots analysis of p‐Akt level in liver, muscle, and iWAT of control and Nos3 +/−, Alb‐Cre mice under ADF intervention for 4 weeks with or without insulin challenge for 15 min, representative blotting images, h) summary analysis of arbitrary unit, n = 6. i) mRNA level of Sdhaf4 and Nos3 and j) serum NO level in the mice under hepatic Sdhaf4 homozygous knockout and/or Nos3 heterozygous knockout, n = 6. k) Immunoblots analysis of p‐Akt level in liver, muscle, and iWAT of mice under hepatic Sdhaf4 homozygous knockout and/or Nos3 heterozygous knockout followed by insulin challenge for 15 min, representative blotting images, l) summary analysis of arbitrary unit, n = 6. m) Glucose tolerance test and n) insulin tolerance test in mice under hepatic Sdhaf4 homozygous knockout and/or Nos3 heterozygous knockout, n = 6. Values are mean ± SEM, *p < 0.05, **p < 0.01.
