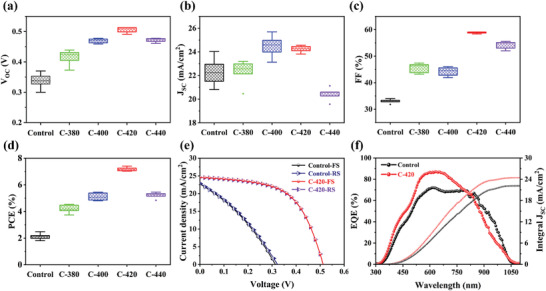
Figure 4.

Statistical distribution of the key performance parameters of the Sb2Se3 thin‐film solar cells, including a) V OC, b) J SC, c) FF, and d) PCE. e) J–V curves of the representative Control and C‐420 devices under forward scan (FS) and reverse scan (RS). f) EQE and integrated J SC of the devices.
