Figure 6.

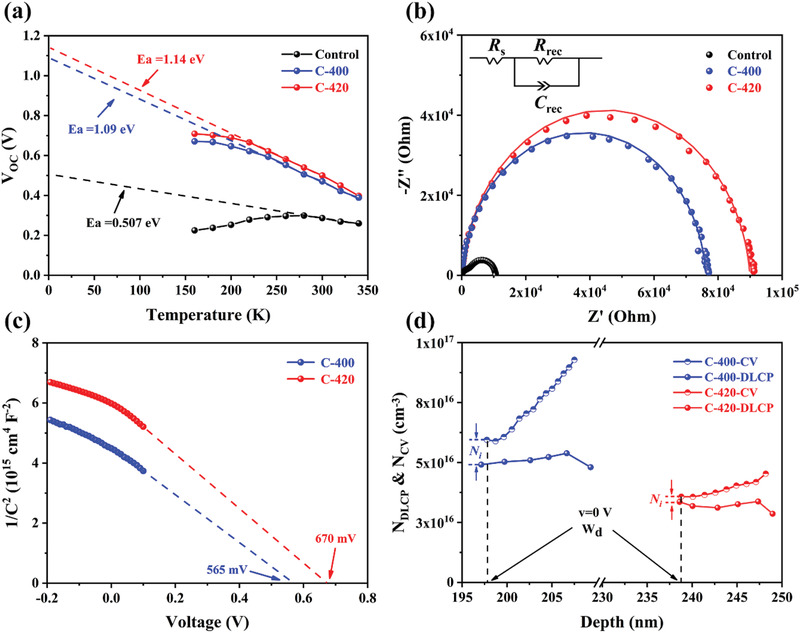
a) Temperature‐dependent V OC measurements, and b) Nyquist plots of the representative Control, C‐400 and C‐420 Sb2Se3 devices. c) 1/C2‐V plots, and d) C–V and DLCP profiles of the C‐400 and C‐420 devices.

a) Temperature‐dependent V OC measurements, and b) Nyquist plots of the representative Control, C‐400 and C‐420 Sb2Se3 devices. c) 1/C2‐V plots, and d) C–V and DLCP profiles of the C‐400 and C‐420 devices.