Figure 4.

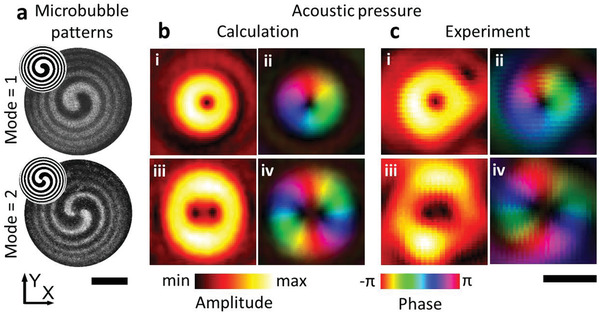
Acoustic phase gradient generation based on the microbubble pattern. a) The microbubble pattern generated on the silicon surface. The images were obtained by subtracting the photo with that before illumination. The scale bar is 10 mm. The projected light patterns are in the upper left insets. The microbubble generation process is shown in Video S2 in the Supporting Information. b) The calculated acoustic fields and the acoustic phase gradient at ii) 1st mode and iv) 2nd mode. c) The experimental results reveal the microbubble pattern modulates the acoustic waves to the target phase gradient. The areas of high pressure in the amplitude have been highlighted in the acoustic phase field (b‐ii, iv) and (c‐ii, iv). The scale bar is 2 mm in (b) and (c).
