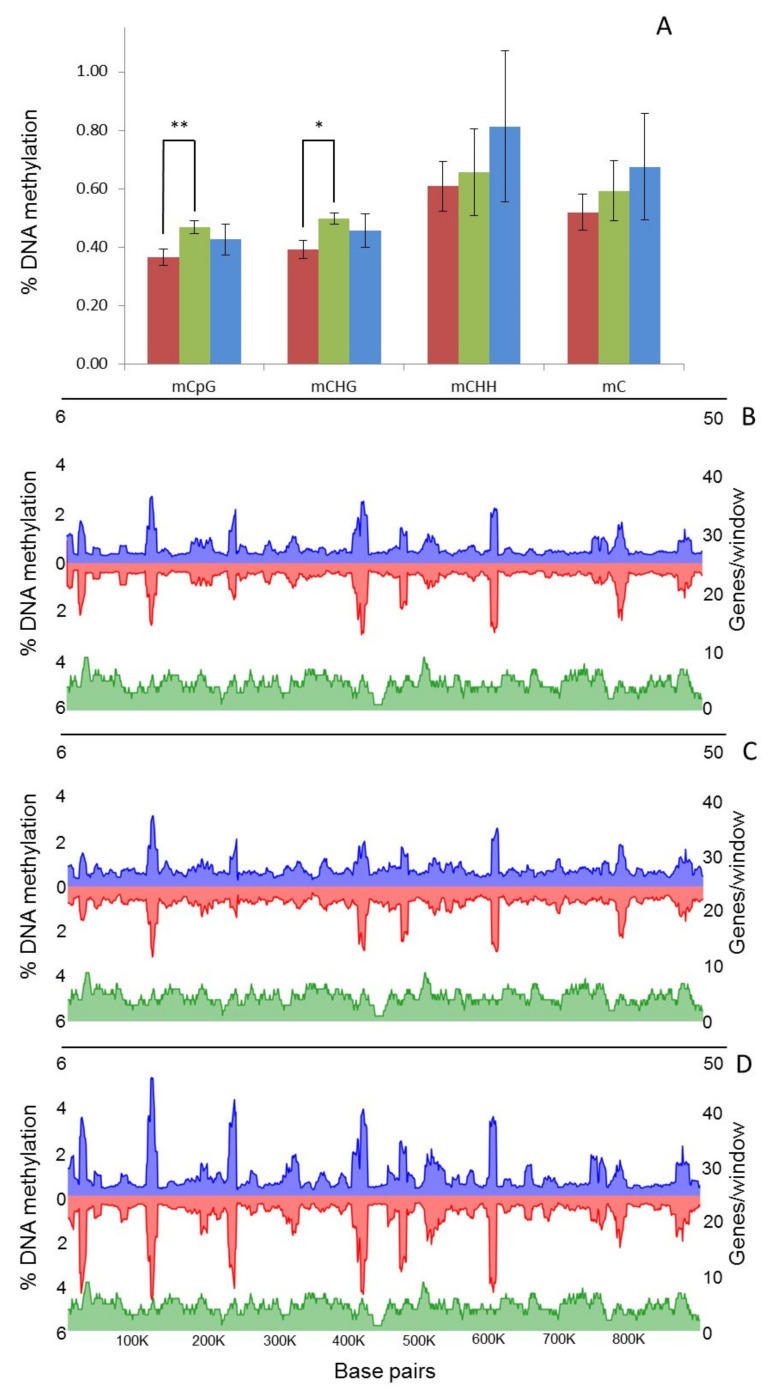
Figure 3.
Global changes on genomic distribution and levels of DNA methylation in B. cinerea. (A) Global average percentage of mCs ((number of mCs/total Cs) × 100) at each time point (T1, red; T8, green; T8P, blue). (B–D) Methylcytosines (mCs) density from each strand (blue, positive and red, negative strand) across Supercontig 1.1 at each time point (B = T1; C = T8 and D = T8P) was calculated and plotted as the percentage of mCs (as above) in each 10 kb window. * (t-test; p < 0.05) and ** (t-test; p < 0.01).

