
FIG. 3.
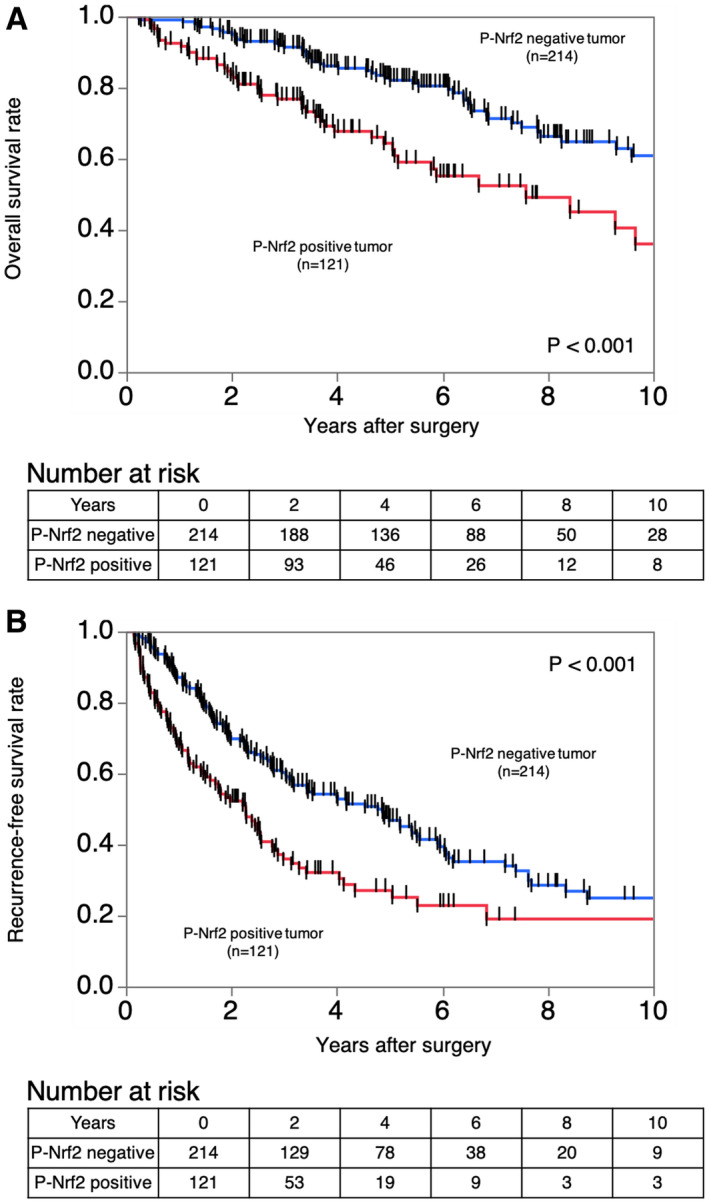
Kaplan‐Meier curves showing the survival of patients with HCC according to the expression of P‐NRF2. (A) RFS in all patients. (B) OS in all patients.
Official websites use .gov
A
.gov website belongs to an official
government organization in the United States.
Secure .gov websites use HTTPS
A lock (
) or https:// means you've safely
connected to the .gov website. Share sensitive
information only on official, secure websites.
Kaplan‐Meier curves showing the survival of patients with HCC according to the expression of P‐NRF2. (A) RFS in all patients. (B) OS in all patients.