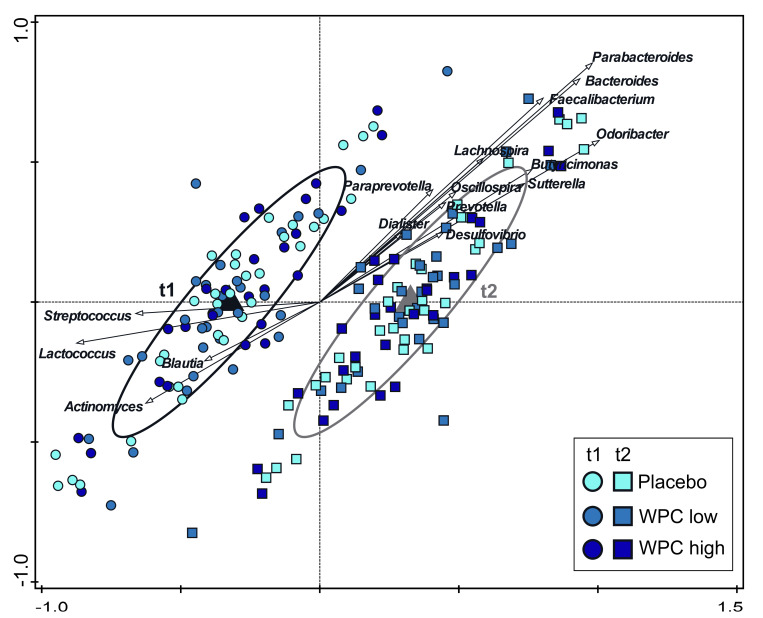
Figure 3.
Redundancy analysis (RDA) of the OTU level. OTUs were used as response data, and time point was explanatory data; the bacterial genera that contributed most are plotted. The covariance attributed to subject was first fitted by regression and then “partialled out” (removed) from the ordination. Variation explained by time point was 2.5%, p = 0.002. Ellipses cover 66% of the observations associated with each time point. Circles are t = 1 samples, and squares are t = 2 samples. Samples are separated based on time point on the first (horizontal) constrained axis, and the second (vertical) unconstrained axis captures a fraction of variation explained by factors other than time point.

