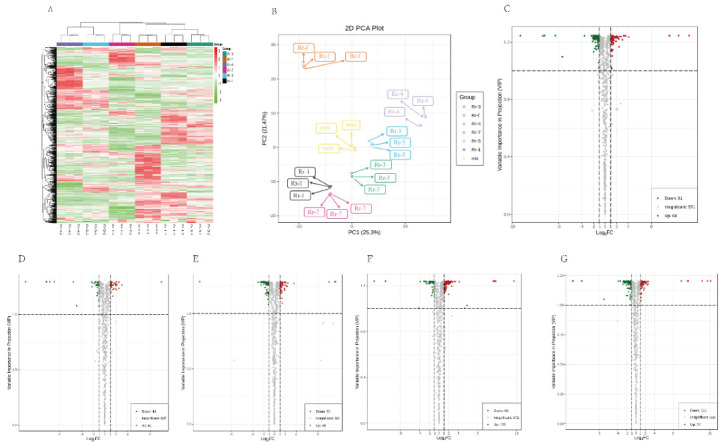
Figure 3.

(A,B) Heat map and PCA of the relative quantification in the detected metabolites among the six R. roxburghii genotypes. (A) Heatmap for six genotypes. The metabolites of all types were normalized to complete the hierarchical linkage clustering. Red indicates high abundance, green indicates relatively low metabolite abundance. (B) Differential metabolites of six genotypes based on PCA. (C–G) Volcano plots showing up-regulated and down-regulated metabolites between pairs of samples from different genotypes. (C) Rr-1 vs. Rr-5. (D) Rr-3 vs. Rr-5. (E) Rr-4 vs. Rr-5. (F) Rr-7 vs. Rr-5. (G) Rr-f vs. Rr-5.
