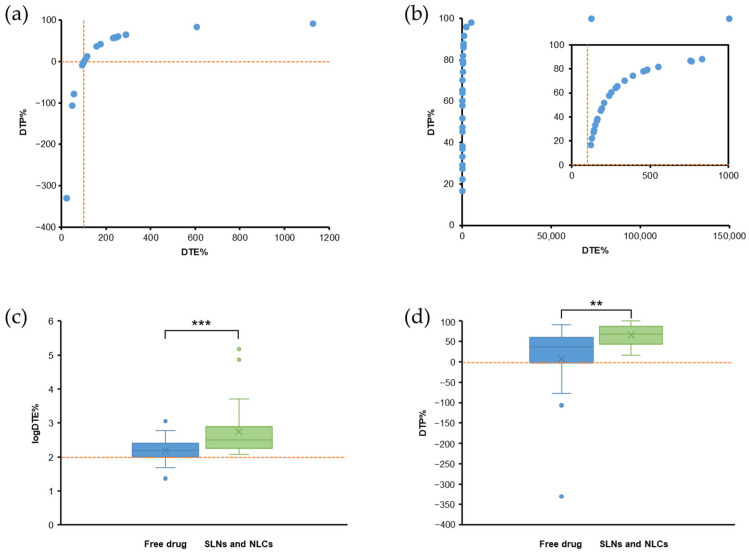
Figure 4.
Summary of DTE% and DTP% for (a) free drug (IN) and (b) SLN and NLC-based formulation (IN). The inset in (b) shows data with DTE% < 1000. The vertical dot-lines in (a,b) are for DTE% = 100; the horizontal dot-line in (a) is for DTP% = 0. (c,d) Comparison of logDTE% and DTP% between free drug (IN) and SLN and NLC-based formulation (IN) using boxplots. × indicates mean value. The horizontal dot-lines in (c) and (d) are for logDTE% = 2 and DTP% = 0, respectively. n = 21 for free drug (IN) and n = 30 for SLN and NLC-based formulation (IN). ** p < 0.01 and *** p < 0.001 (t-test).

