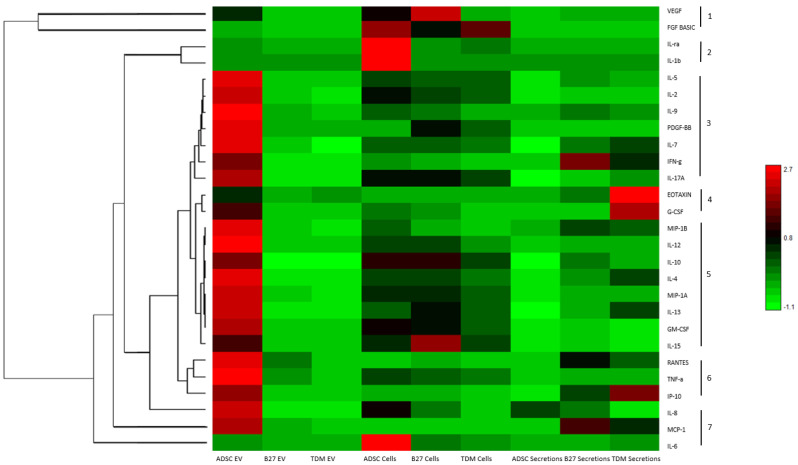
Figure 2.
Heatmap and dendrogram of Bioplex quantified cytokines from cells, EVs and secretions derived from control ADSCs, B27 treated cells and TDM treated cells. Log10 scale where relatively red is high and green is low. The dendrogram represents hierarchical Euclidean clustering of cytokines across measured samples with 7 distinct groups.

