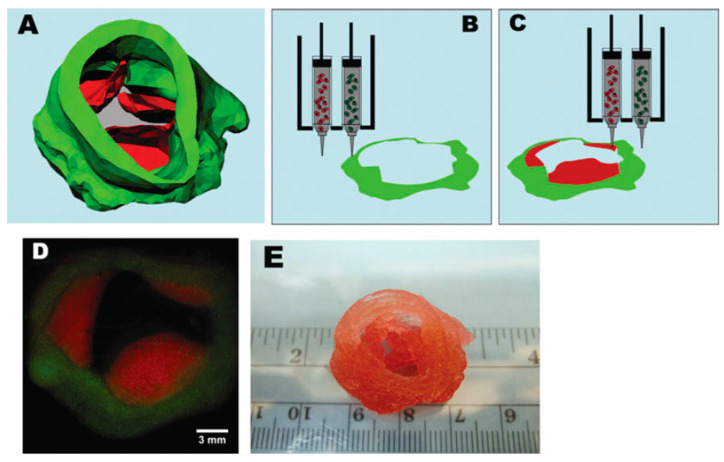
Figure 9.
Bioprinting of aortic valve conduit: (A) aortic valve model based on micro-CT images. The root (green) and leaflet (red) regions were identified and rendered separately as 3D geometries, saved in STL format; (B,C) schematic illustrations of the bioprinting process with two different cell types and syringes; (B) root region of first layer of hydrogel embedded with SMC; (C) leaflet region of first layer obtained from VIC hydrogel; (D) fluorescent image of first two layers of aortic valve conduit; SMC for valve root shown in green and VIC for valve in red; (E) 3D bioprinted aortic valve conduit (Reprinted from Duan et al., 2013 [321], with the permission of John Wiley & Sons Inc., published under license. Copyright © 2022 Wiley Periodicals Inc.).

