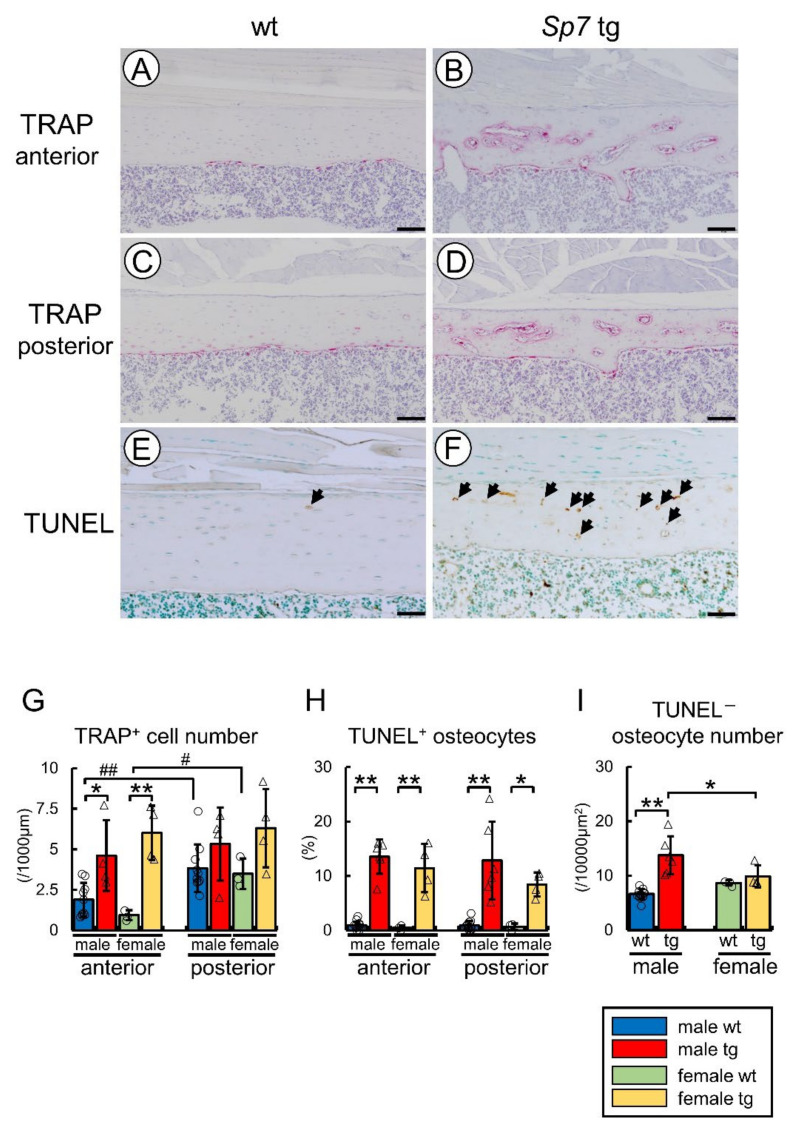
Figure 2.
TRAP and TUNEL staining: (A–F) TRAP staining in the anterior cortical bone (A,B) and the posterior cortical bone (C,D) and TUNEL (E,F) staining in the anterior cortical bone in the femurs of female wild-type (A,C,E) and Sp7 tg (B,D,F) mice. Arrows in E and F show TUNEL-positive lacunae. Scale bars: 200 μm (A–D); 100 μm (E,F). (G) The number of TRAP-positive cells in the anterior and posterior cortical bone. The number of mice that were analyzed; male wt: 10, male tg: 4, female wt: 3, female tg: 4. (H) Frequencies of TUNEL-positive lacunae in the anterior and posterior cortical bone. (I) The number of TUNEL-negative osteocytes. The number of mice that were analyzed in (H,I); male wt: 13, male tg: 6, female wt: 3, female tg: 4. *,# p < 0.05. **,## p < 0.01 by Tukey–Kramer test * and Student’s t-test #.

