Figure 6.
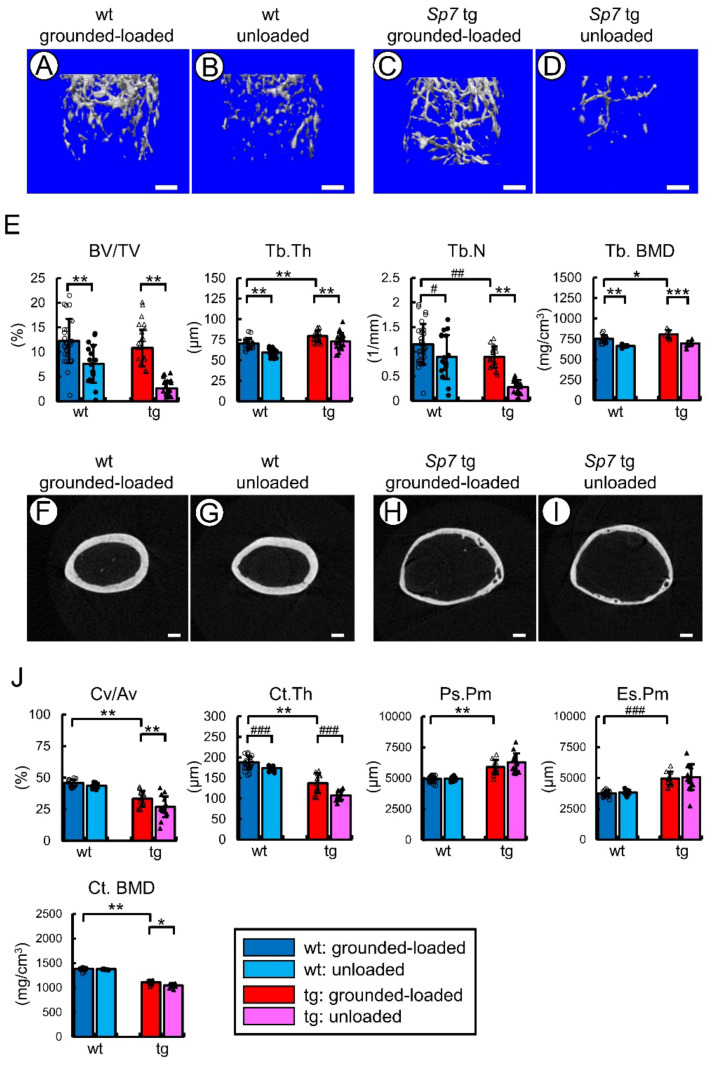
Micro-CT analysis of femurs in the grounded-loaded and unloaded mice: tail suspension was performed for two weeks using male wild-type and Sp7 tg mice. (A–E) Three-dimensional trabecular bone architecture of distal femoral metaphysis (A–D), and quantification of the trabecular bone volume (bone volume/tissue volume, BV/TV), trabecular thickness (Tb.Th), trabecular number (Tb.N), and trabecular bone mineral density (Tb.BMD) (E). (F–J) Micro-CT images of the cortical bone at mid-diaphysis in femurs (F–I), and the quantification of the cortical bone ratio (cortical bone volume/all bone volume, Cv/Av), cortical thickness (Ct.Th), periosteal perimeter (Ps.Pm), endosteal perimeter (Es.Pm), and cortical bone mineral density (Ct.BMD) (J). Scale bars: 0.5 mm (A–D); 0.2 mm (F–I). The number of mice that were analyzed; grounded-loaded wild-type: 30 (BMD: 16), unloaded wild-type: 18 (BMD: 6), grounded-loaded tg: 19 (BMD: 8), unloaded tg: 19 (BMD: 9). *,# p < 0.05, **,## p < 0.01, ***,### p < 0.001 by Tukey–Kramer test * and Student’s t-test #. The parameters of trabecular and cortical bone in the wild-type and Sp7 tg mice in the grounded-loaded condition in Figure 1J,K are shown for the comparison of grounded-loaded and unloaded mice in (E,J), respectively. The data were collected from two independent experiments except BMD.

