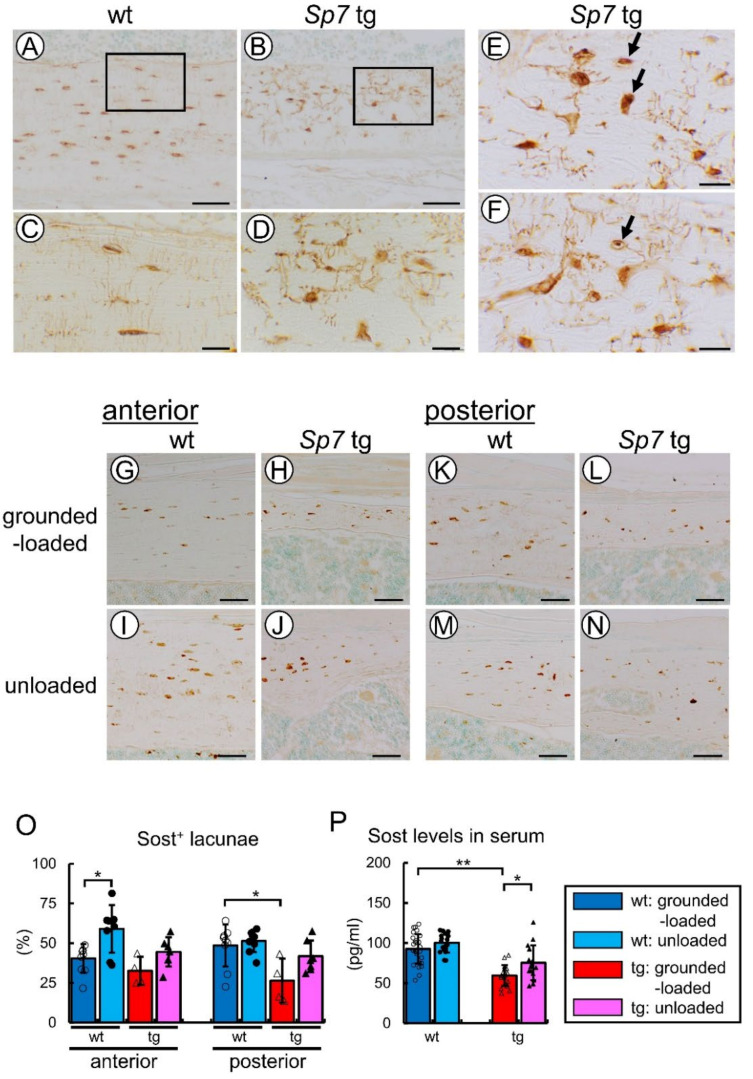
Figure 11.
Immunohistochemical analysis of Sost and serum levels of Sost: (A–F) Immunohistochemistry of the posterior femoral cortical bone in female wild-type (A,C) and Sp7 tg (B,D–F) mice using anti-Sost antibody. The boxed regions in (A,B) are magnified in (C,D), respectively. The arrows in (E,F) show apoptotic or necrotic osteocytes, which were non-specifically stained with Sost. (G-N) Immunohistochemistry of the anterior (G–J) and posterior (K–N) femoral cortical bone in the grounded-loaded (G,H,K,L) and unloaded (I,J,M,N) wild-type (G,I,K,M) and Sp7 tg (H,J,L,N) male mice using anti-Sost antibody. Scale bars = 100 μm (A,B); 10 μm (C–F); 50 μm (G–N). (O) Percentages of Sost-positive osteocytes in the anterior and posterior cortical bone. The eight groups were compared. The number of mice that were analyzed; grounded-loaded wild-type: 9, unloaded wild-type: 8, grounded-loaded tg: 4, unloaded tg: 7. * p < 0.05. (P) Serum levels of Sost in grounded-loaded and unloaded male mice. The number of mice analyzed; grounded-loaded wild-type: 28, unloaded wild-type: 17, grounded-loaded tg: 19, unloaded tg: 15. * p < 0.05, ** p < 0.01 by Tukey–Kramer test. The data were collected from two independent experiments.

