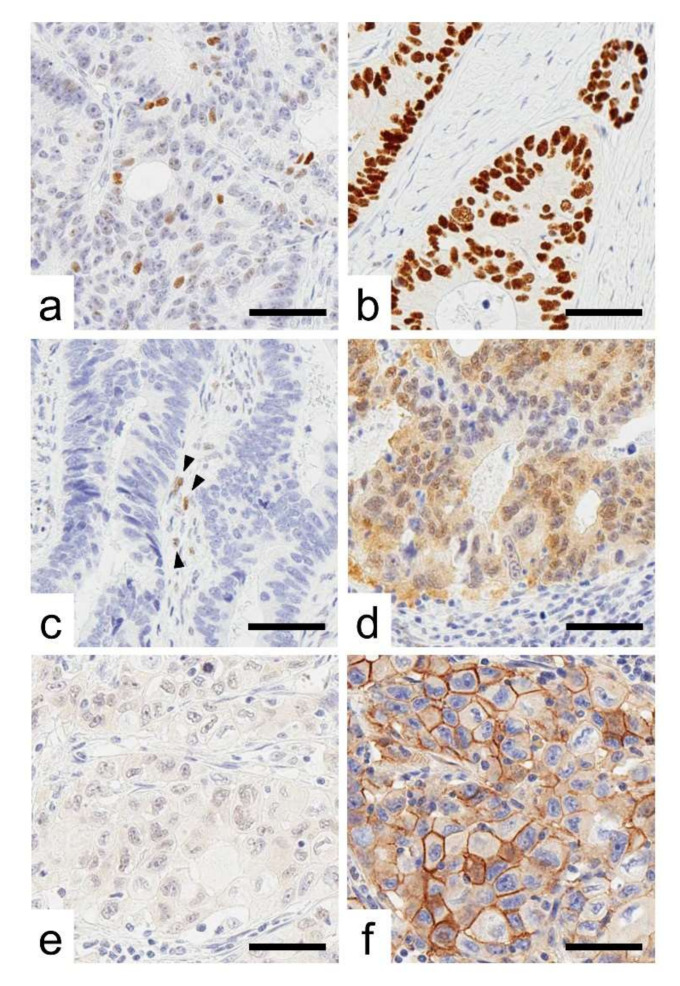
Figure 1.
Representative images of p53 immunoreactivity. (a–d), Representative images of p53 immunoreactivity. (a) Wild-type pattern, (b) overexpression, (c) cytoplasmic expression, and (d) complete loss. Arrow heads indicate internal control cells with weak p53 nuclear expression. (e,f), CRC cases with the “stem-like” immunophenotype showing CDX2-negative (e) and ALCAM-positive expression (f). Bar, 50 µm.

