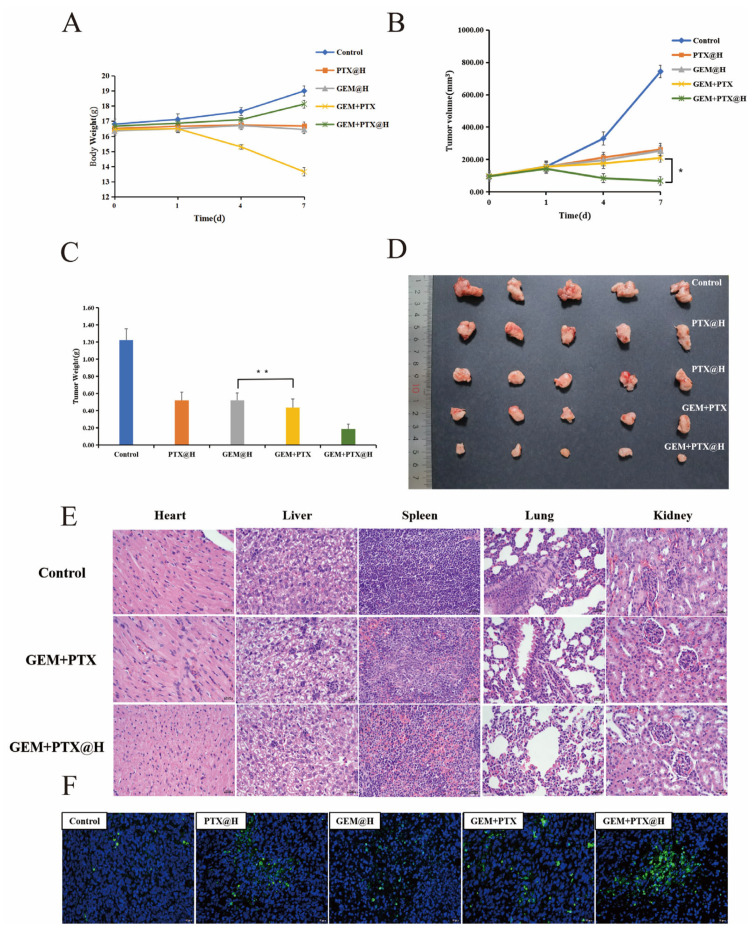
Figure 3.
The body weight change curve of mice after administration (A). The tumor volume change curve of mice after administration (B). The tumor weight of mice 7 days after administration (C). Images of the tumors harvested from mice in the control group, the PTX@H group, the GEM@H group, the GEM+PTX group and the GEM+PTX@H group 7 days after administration (D). H&E-based immunohistochemical images of five major organs harvested from the tumor-bearing mice 7 days after administration (E). TUNEL-based immunohistochemical images of the tumor harvested from a tumor-bearing mouse 7 days after administration (F). * p < 0.1, ** p < 0.01.

