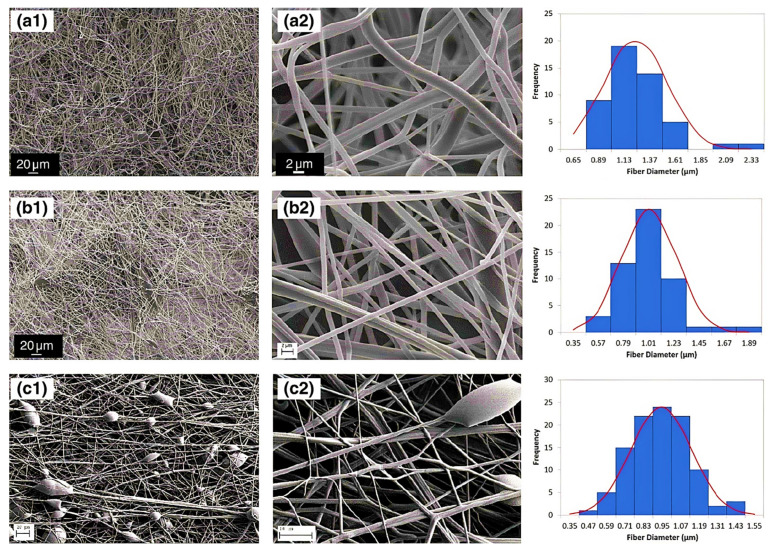
Figure 3.
Diameter distribution and SEM micrographs of nanofibers of PAA (a) concentration of 12 wt% PAA and speed of 6000 rpm, (b) concentration of 12 wt% PAA concentration and speed of 8000 rpm, and (c) concentration of 9 wt% PAA concentration and speed of 4000 rpm. The SEM micrographs were taken at various magnifications: (a1,b1) 600×, (c1) 300×, (a2,b2) 7000×, and (c2) 15,000×. (Reprinted from Ref. [73] with permission).

