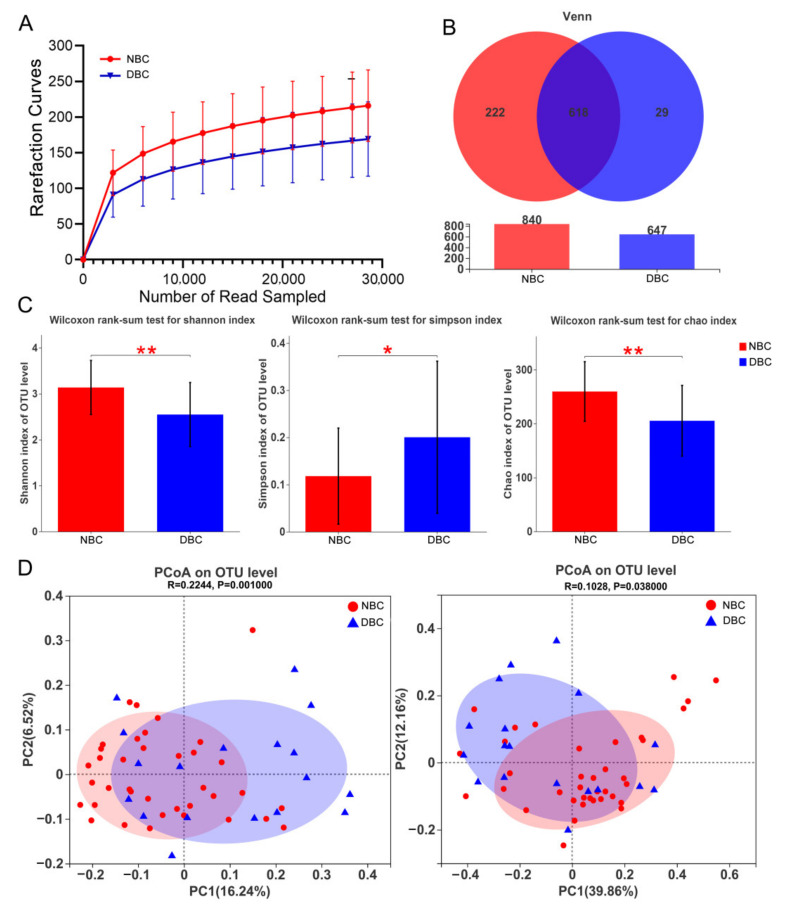
Figure 2.
Differences in gut microbiota structure between the DBC and NBC patients. (A) The rarefaction curves to assess the sequencing depth. (B) Venn diagram showing the shared number of operational taxonomic units by DBC and NBC patients. (C) Shannon index, Simpson index and Chao index were used to measure richness and diversity. A higher value of the Shannon index indicates a higher community diversity, whereas a higher Simpson index indicates a lower community diversity. The Wilcoxon rank-sum test was used. (D) Unweighted (left) and weighted (right) UniFrac distance-based principal coordinate analysis (PCoA). The percentages of variation explained by PC1 and PC2 are shown on the axis. Distances between the samples were based on similarity in OTU composition (OTU similarity: 97%). A greater distance indicates a lower similarity, and similar OTUs cluster together. The statistical significance was evaluated with analysis of similarities (ANOSIM). DBC, depressed breast cancer patients (n = 18); NBC, non-depressed breast cancer patients (n = 37). * p < 0.05, ** p < 0.01.

