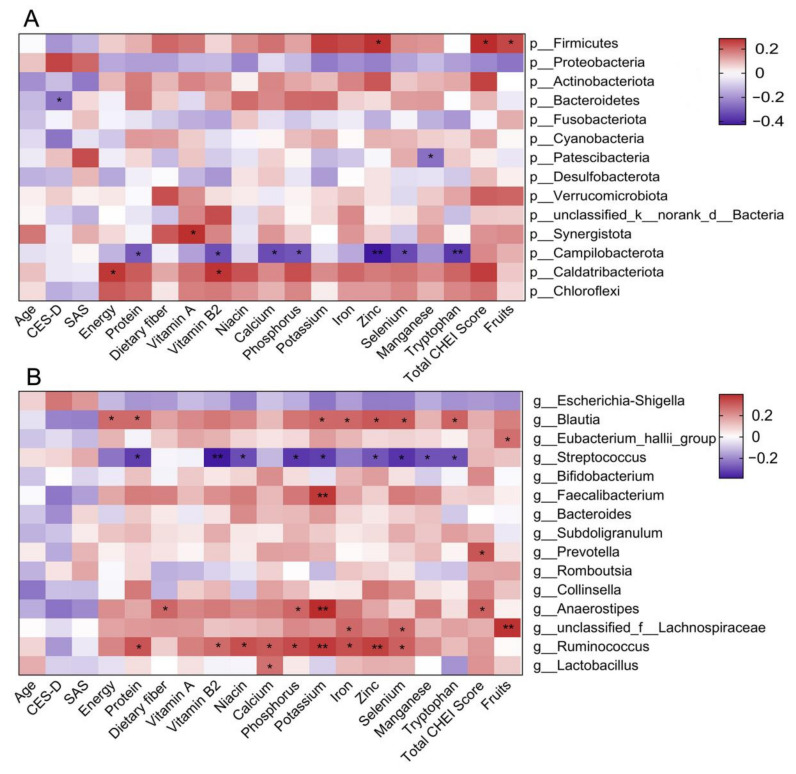
Figure 5.
Spearman and Pearson correlation analysis between the abundance of the top 15 taxa at the phylum (A) and genus (B) levels and the CES-D score, nutrient intakes and CHEI component scores (n = 55). The color denotes the strength of the correlation, where red indicates positive, and blue indicates negative. The correlations between Firmicutes, except for vitamin B2, manganese and the CHEI fruit score, were performed with Pearson correlation analysis; the rest of the associations were analyzed with Spearman correlation analysis. CES-D, Center for Epidemiological Studies-Depression; SAS, Self-Rating Anxiety Scale; CHEI, Chinese Healthy Eating Index. * p < 0.05, ** p < 0.01.

