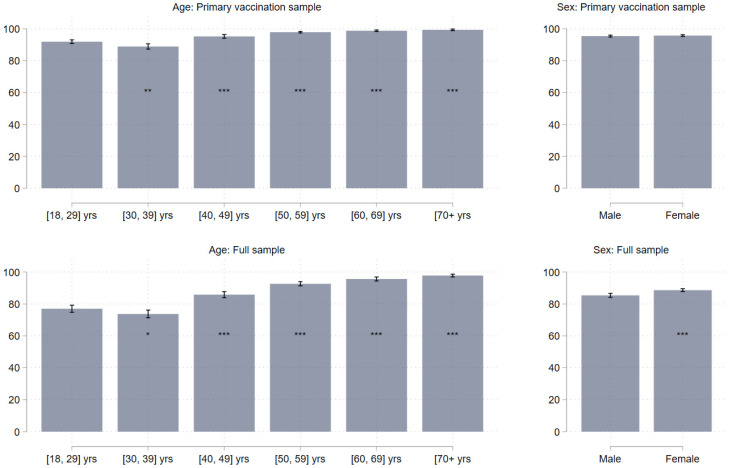
Figure 2.
Booster vaccine willingness by age and sex. Note: Bars reflect the estimated willingness to take a booster dose. Whiskers denote 95% confidence intervals. * p < 0.05, ** p < 0.01, *** p < 0.001. Stars reflect whether there is a statistically significant difference between the reference category (age: 18–29 yrs; sex: male) and each of the other categories. Robust standard errors. Top panels reflect estimates from the primary vaccination sample (30,653), whereas the bottom panels reflect estimates from the full sample (N = 31,721).

