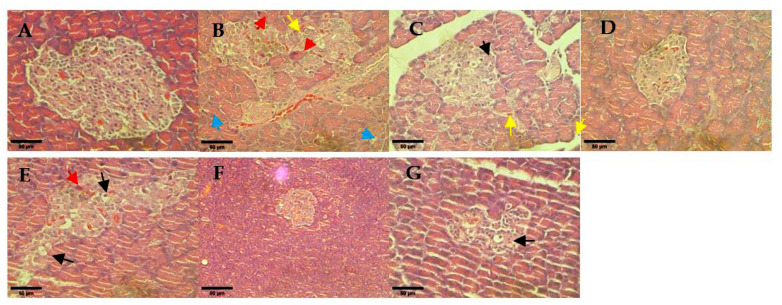
Figure 8.
Histological observation of rat pancreas for different treatment diabetes groups: (A) non-diabetes; (B) untreated diabetes; (C) glibenclamide; (D) 0.25 mg/kg hUC-MSCs-sEVs; (E) 0.5 mg/kg hUC-MSCs-sEVs; (F) 1 mg/kg hUC-MSCs-sEVs; (G) hUC-MSCs. The red arrows show cell necrosis. The yellow arrows show leukocytic cell infiltration. The blue arrows show cytoplasmic vacuolation. The black arrows show hydropic degeneration. All sections were stained with haematoxylin and eosin and viewed under an inverted light microscope. 400× magnification; Scale bar represents 50 µm.

